Figures & data
Table 1A. Growth of the AAPCC population served and exposure reporting (1983–2008)
Fig. 1. Human Exposure Calls, Information Calls and Animal Exposure Calls by Day since January 1, 2000.
Line shows least-squares linear regression, DT = doubling time from the slope of the linear regression of the log-calls/day and 90% confidence interval.
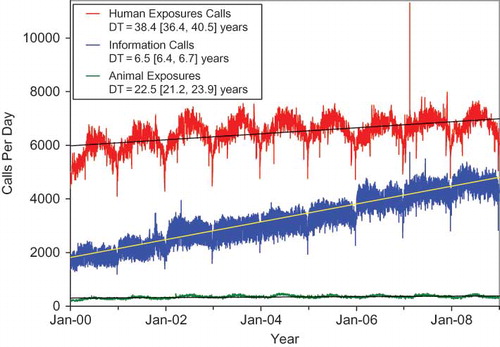
Fig. 2. Drug Identification and Law Enforcement Drug Identification Calls by Day since January 1, 2000.
Line shows least-squares linear regression, DT = doubling time from the slope of the linear regression of the log-calls/day and 90% confidence interval.
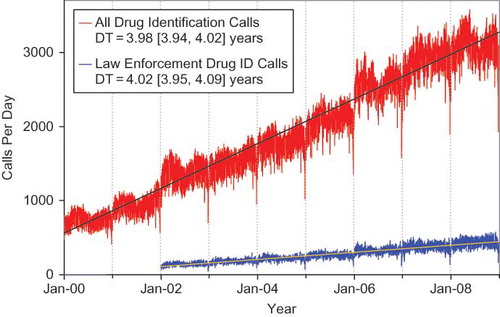
Fig. 3. Information Calls (total) for 2008 by Day of Week.
Means and SEM (diamonds) and SDs (horizontal lines) by Oneway ANOVA, F(6, 1) = 78.3, p<0.0001, Rsquare = 0.566, N = 366. Fewest calls (N = 2825) was Thursday December 25, 2008. Data array shows the Mean ± SD [90% confidence interval] by day of the week for each of the call types in and .
![Fig. 3. Information Calls (total) for 2008 by Day of Week.Means and SEM (diamonds) and SDs (horizontal lines) by Oneway ANOVA, F(6, 1) = 78.3, p<0.0001, Rsquare = 0.566, N = 366. Fewest calls (N = 2825) was Thursday December 25, 2008. Data array shows the Mean ± SD [90% confidence interval] by day of the week for each of the call types in Figures 1 and 2.](/cms/asset/4e656af1-ce39-4805-96ac-5721a33bec5f/ictx_a_444217_f0003_b.jpg)
Table 1B. Non-human exposures by animal type
Table 1C. Distribution of information calls
Table 2. Site of call and site of exposure, human exposure cases
Table 3. Age and gender distribution of human exposures
Table 5. Number of substances involved in human exposure cases
Table 6A. Reason for human exposure cases
Table 6B. Scenarios for therapeutic errors by age
Table 7. Distribution of reason for exposure by age
Table 9. Route of exposure for human exposure cases
Table 10. Management site of human exposures
Table 11. Medical outcome of human exposure cases by patient age
Table 12. Medical outcome by reason for exposure in human exposures
Table 13. Duration of clinical effects by medical outcome
Table 14. Decontamination and therapeutic interventions
Table 15. Therapy provided in human exposures by age
Table 16. Decontamination trends (1985–2008)
Table 17A. Substance categories most frequently involved in human exposures (Top 25)
Table 17B. Substance categories most frequently involved in pediatric (≤ 5 y) exposures (Top 25)
Table 17C. Substance categories most frequently involved in adult (≥20 y) exposures (Top 25)
Table 18. Categories associated with largest number of fatalities (Top 25)
Table 19. Comparisons of death data (1985–2008)
Table 20. Frequency of plant exposures (Top 25)
Table 21. Listing of fatal nonpharmaceutical and pharmaceutical exposures (this table can be viewed separately online at www.informahealthcare.com/ctx)
Table 22A. Demographic profile of SINGLE-SUBSTANCE nonpharmaceuticals exposure cases by generic category (this table can be viewed separately online at www.informahealthcare.com/ctx)
Table 22B. Demographic profile of SINGLE-SUBSTANCE pharmaceuticals exposure cases by generic category (this table can be viewed separately online at www.informahealthcare.com/ctx)
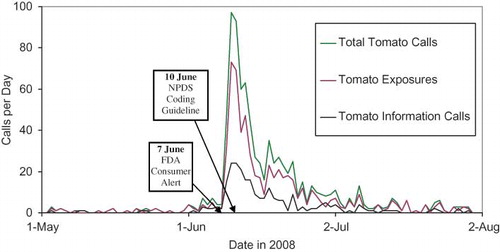
Fig. 4. Tomato Exposure and Information Calls by Day, 1 May – 2 August 2008.