
Figures & data
Table I. Characteristics of trial populations.
Table II. Baseline scores of clinical outcome measures [mean/(SD)].
Figure 1. Changes of SKT total scores based on the full analysis set (FAS).
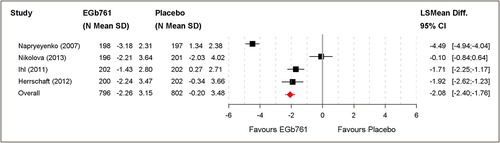
Figure 2. Changes of NPI total scores [A] and caregiver distress scores [B] based on the full analysis set (FAS).
![Figure 2. Changes of NPI total scores [A] and caregiver distress scores [B] based on the full analysis set (FAS).](/cms/asset/b03bbc47-96c5-42e4-b9a3-25a9fa04449c/iwbp_a_1066513_f0002_oc.jpg)
Figure 3. Changes of ADL scores (GBS-ADL, ADL-IS) based on the full analysis set (FAS).
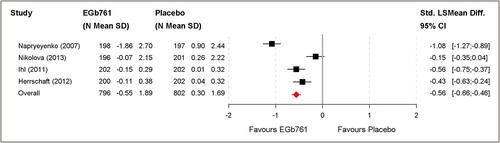
Figure 4. Clinical global assessment (change scores of GBS-total score, ADCS-CGIC) based on the full analysis set (FAS).
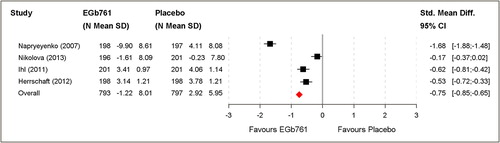
Figure 5. Changes of DEMQOL-PROXY total score based on the full analysis set (FAS).
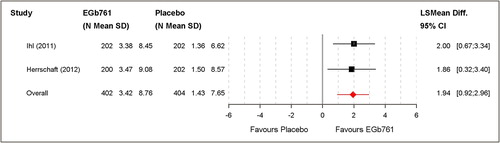
Table III. Aggregated outcomes for diagnostic subgroups; mean changes from baseline with standard deviations; LS mean differences (SKT, NPI, DEMQOL-Proxy), standardised LS mean differences (GBS-ADL, ADL-IS) or standardised mean differences (GBS total score, ADCS-CGIC) and 95% confidence intervals.
Table IV. Summary of results of the responder analysis.
Table V. Numbers of serious adverse events under EGb 761® and placebo treatment, respectively.