Figures & data
Table I. Characterisation and physico-chemical properties of the raw material: colloidal SAS.
Figure 1. Overview on the methodological approach and building blocks of the risk assessment. Methods mentioned in detail indicate experimental analyses performed in this case study.
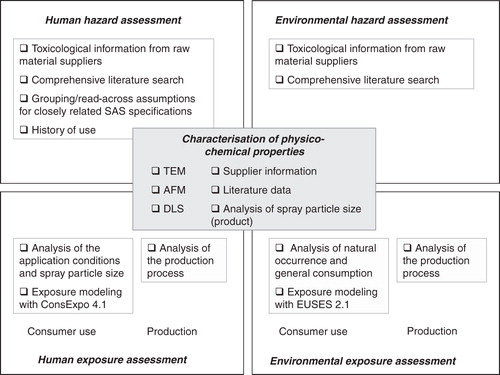
Figure 2. Literature search for toxicological information: the search terms and links between search terms are given as well as the number of hits.
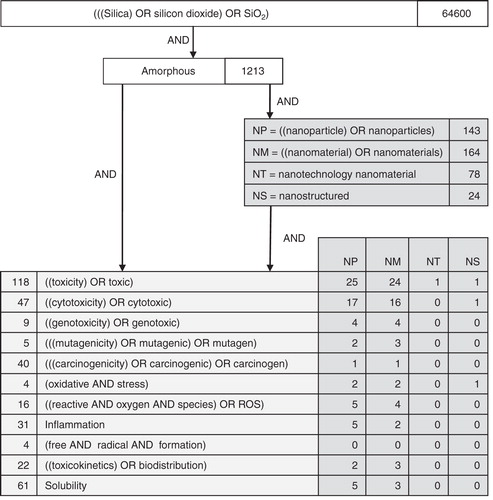
Table II. Aerosol droplet size distribution of the glass cleaner.
Figure 3. Analysis of size, shape and aggregation state of SAS particles in the raw material by transmission electron microscopy. A. Besides single particles, the state of aggregation and agglomerate on can be seen with lower resolution (1:250,000). The whole bar is 100 nm and one segment of it is 20 nm. B. With higher resolution, the size of the individual particles becomes more visible (1:560,000). The whole bar is 50 nm and one segment of it is 10 nm.
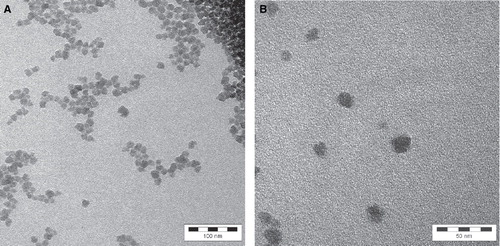
Figure 4. Particle size distribution of the raw material by dynamic light scattering.
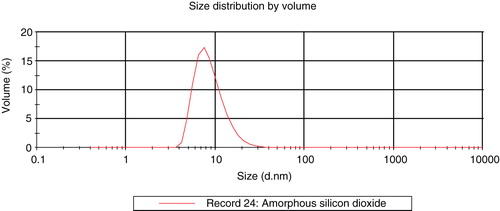
Figure 5. Analysis of the colloidal SAS applied on a glass slide by atomic force microscopy.
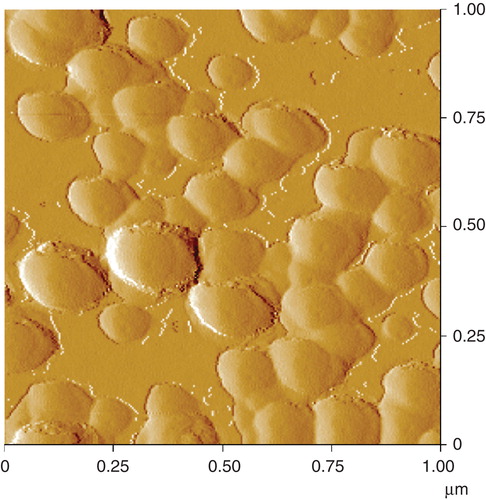
Table III. Summary of literature data on the algal toxicity of SAS.
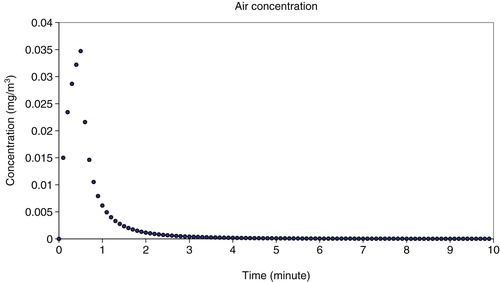
Figure 6. Calculated air concentration of SAS during consumer exposure towards the glass cleaner spray.