Figures & data
Figure 1. Schematic illustration of the platform used to study the response of the human airway epithelium to nanoparticles. (A) Human airway epithelial cells are grown on an insert such that the apical (top) surface is exposed to air and the basolateral (bottom) surface to media for 6 weeks prior to study to allow the cells to differentiate. The epithelial resistance across the monolayer is determined using a current source. (B) Quantum dots functionalised with positive or negative charge are introduced at the apical surface. (C) QDs can traverse the airway epithelium via paracellular or transcellular pathways. (D After exposures of airway epithelial cells to QDs, cells are washed and then 4 kDa FITC-dextran is placed on the apical surface and incubated for 20 min, after which the basolateral media is sampled to assess FITC concentration as a permeability assessment.
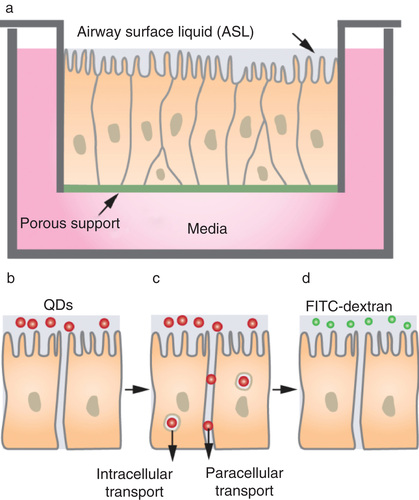
Figure 2. (A) Schematic illustration of lipid functionalised quantum dots. The outer leaflet contains 20 mol% Octadecylamine (positive charge) or stearic acid (negative charge). (B) The zeta potential was 49 mV for ODA-modified QDs and -50 mV for SA-modified QDs. (C) Particle size distributions for ODA-modified QDs (red) and SA-modified QDs (blue) (Green Citation2004). (D) (left) Size distributions and (right) absorbance spectra for ODA-functionalised QDs: (green) QDs in distilled water, (blue) QDs immediately after transferring to media, and (red) QDs after 12 suspension in media.
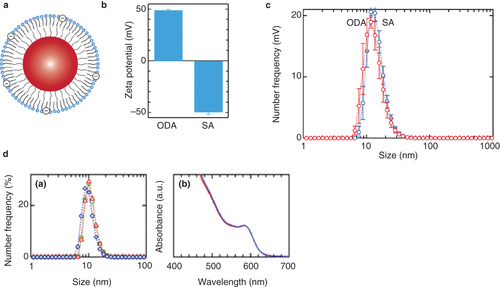
Figure 3. (A) After 5 min exposure, QDs penetrate the epithelium. Fluorescence images for airway epithelial cells 5 min after incubating with a dose of 10 NP/cell. (Green) Cell membrane, (red) QDs. After 5 min exposure, the majority of the negatively charged QDs are located at the cell–cell junctions, whereas the majority of the positively charged QDs are located with the cells. (B) By measuring the fluorescence in the basolateral media we can assess QD transport across the epithelial barrier. Both negatively and positively charged particles cross the epithelial barrier. (Bars represent standard error (SE), n = 3 for each dose; Anova one-way (p < 0.025)).
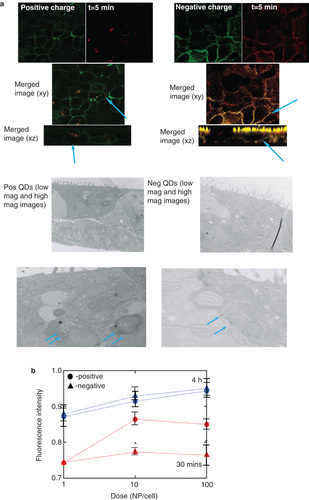
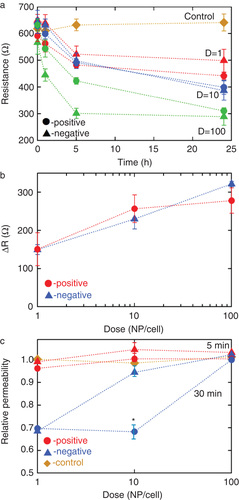
Figure 4. Nanoparticle exposure results in altered airway epithelial barrier function. (A) TER versus time for airway epithelial cells incubated with 1, 10 or 100 NP/cell. Both positively and negatively charged QDs decrease TER in a dose-responsive fashion. The control represents incubation with buffer only. (Bars represent standard error (SE) with at least three independent experiments) (B) The change in TER after 24 h increases exponentially with dose, independent of charge. (C) After exposure to QD, the 4 kD FITC-dextran was placed in the apical chamber and after incubating for 20 min (37oC) the basolateral media was sampled to assess fluorescence. In response to 30 min of exposure to a very low exposure of QD (in the order of 1 NP/cell), there was a significant decrease in paracellular permeability. (Bars represent standard error (SE), n = 3 per condition; Anova one-way (p < 0.025)).