Figures & data
Table I. Characterisation of nanomaterial dispersions in Milli-Q and saline–BHI solutions with a nominal concentration of 100 mg l− 1.
Figure 1. Example transmission electron microscopy images of ENMs and their salt metal or bulk controls in 100 mg l−1 Milli-Q water solutions showing (A) TiO2 NPs, (B) bulk TiO2, (C) Ag NPs, (D) AgNO3, (E) CL silica NPs, (F) HS-30 silica NPs and (G) silica MPs. Image H shows the saline–BHI + 2% sucrose media where the presence of the NaCl crystals is apparent. The respective nanosight graphs show the particle distribution (bin sizes are hydrodynamic diameter) of the nanomaterials and their salt metal or bulk controls in 100 mg l−1 saline-BHI + 2% sucrose solutions.
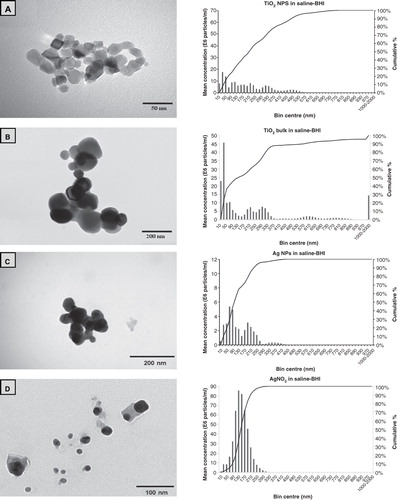
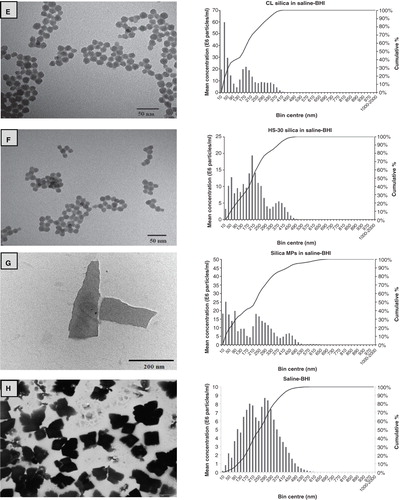
Figure 2. The effect of nanomaterials on bacterial growth in the MIC test, measured as absorbance values recorded after a 24 h exposure of the S. mutans to the test media compared to appropriate controls. Dilutions series of 1, 1/2, 1/4, 1/8, 1/16 and 1/32 correspond to 100, 50, 25, 12.5, 6.25 and 3.125 mg l−1, respectively of each material used. (A) Total absorbance values caused by bacterial growth as well as the natural turbidity of the solutions. Line A corresponds to the absorbance for the inoculated saline control before incubation representing the absorbance levels for complete inhibition of bacterial growth and line B corresponds to the absorbance for the inoculated saline after 24 h of incubation expressing no antibacterial activity. (B) Absorbance values related exclusively to the bacterial growth, after correction for the natural turbidity of the solutions; “*” shows significant difference from the saline negative control and “+” shows statistical difference from the corresponding dilution of the chlorhexidine positive control (one-way ANOVA, p < 0.05). Within a test solution, different letters indicate significant differences (one-way ANOVA, p < 0.05) between the dilution series, whereas complete absence of letters means no statistical difference between any of the dilutions; “#” shows that the nanosolutions were significantly different (two-way ANOVA, p < 0.05) from their corresponding salt metal or bulk control, whereas “NS” means no significant difference. Brackets show the groups compared.
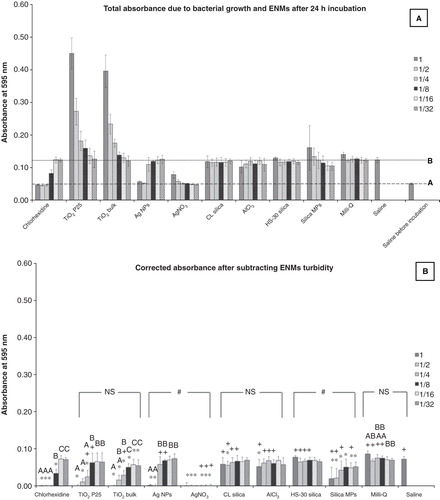
Figure 3. Percentage of live S. mutans after a 24 h exposure to dispersions of nanomaterials compared to bulk or metal salt controls. Dilutions series of 1, 1/2, 1/4, 1/8, 1/16 and 1/32 correspond to 100, 50, 25, 12.5, 6.25 and 3.125 mg l−1, respectively of each material used; “*” shows significant difference from the saline negative control and “+” shows statistical difference from the corresponding dilution of the chlorhexidine positive control (one-way ANOVA, p < 0.05). Within a test solution, different letters indicate significant differences (one-way ANOVA, p < 0.05) between the dilution series, whereas complete absence of letters means no statistical difference between any of the dilutions; “#” shows that the nanosolutions were significantly different (two-way ANOVA, p < 0.05) from their corresponding salt metal or bulk control, whereas “NS” means no significant difference. Brackets show the groups compared.
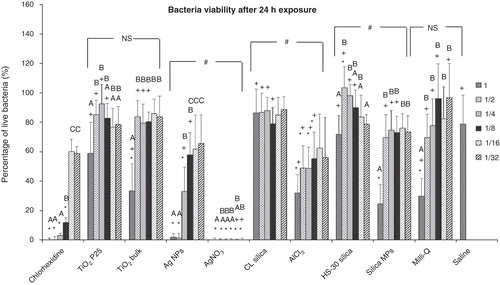
Figure 4. Lactate production of S. mutans after a 24 h exposure to dispersions of nanomaterials compared to bulk or metal salt controls. Dilutions series of 1, 1/2, 1/4, 1/8, 1/16 and 1/32 correspond to 100, 50, 25, 12.5, 6.25 and 3.125 mg l−1, respectively of each material used; “*” shows significant difference from the saline negative control and “+” shows statistical difference from the corresponding dilution of the chlorhexidine positive control (one-way ANOVA, p < 0.05). Within a test solution, different letters indicate significant differences (one-way ANOVA, p < 0.05) between the dilution series, whereas complete absence of letters means no statistical difference between any of the dilutions; “#” shows that the nanosolutions were significantly different (two-way ANOVA, p < 0.05) from their corresponding salt metal or bulk control, whereas “NS” means no significant difference. Brackets show the groups compared.
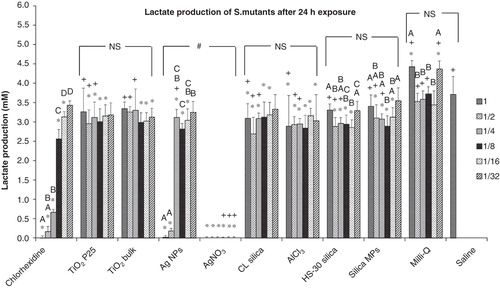
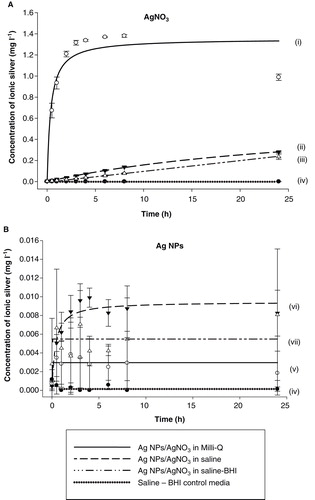
Figure 5. Dialysis curves showing the release of total dissolved silver from (A) AgNO3 and (B) Ag NPs over a 24 h period when suspended in Milli-Q, saline and saline–BHI media. A pure saline–BHI media was assigned as control. Data are means ± S.D, n = 3 replicates. Curves were fitted using SigmaPlot 12 (Systat Software, Inc.) applying the legal binding one site saturation equation on the raw data: (i) y = 1.35·abs(x)/(0.38 + abs(x)), (ii) y = 0.64·abs(x)/(30.46 + abs(x)), (iii) y = 316222.27·abs(x)/(32353213.72 + abs(x)), (iv) y = 0.003·abs(x)/(2.40E-017 + abs(x)), (v) y = 0.01·abs(x)/(0.38 + abs(x)), (vi) y = 0.01·abs(x)/(1.45E-017 + abs(x)) and (vii) y = 0.0002·abs(x)/(1.64E-016 + abs(x)). The y-axis scale for panel B is notably smaller compared to that of panel A. All three curves for Ag NPs shown in panel B are practically superimposed with the curve of the saline–BHI control in panel A. r 2 values for curve fits for AgNO3 (0.89-0.997) and for Ag NPs in saline (0.75) were good, but not for Ag NPs in Milli-Q water or saline-BHI media (<0.2) as ion release was very low.