Figures & data
Table 1. Detailed physical and chemical characteristics of nano-TiO2 (UV-Titan L181) particles (modified from Halappanavar et al., Citation2011; Hougaard et al., Citation2010; Husain et al., Citation2013).
Table 2. Dynamic light scattering analysis of particle size distributions in the exposure medium.
Figure 1. Detection of nano-TiO2 particles in heart and liver tissues using Nano-scale Hyperspectral Microscopy. Liver and heart tissues from mice exposed to 18 and 162 µg of nano-TiO2 via intratracheal instillation and sampled 1 d (24 h) and 28 d post-exposure. Microscopic slides containing approximately 5 µm tissue sections were subjected to visible and near-infrared hyperspectral imaging to detect the particles in (a) liver and (b) heart tissues. Top panels in both (a) and (b) show spectral libraries from control (left image) and nano-TiO2 exposed (right image) tissues, respectively. Middle panels for the same show dark field hyperspectral images from control and nano-TiO2 exposed tissues. Bottom panels show hyperspectral mapping of nano-TiO2 in the (a) liver and (b) heart tissues; nano-TiO2 appear as red dots or aggregates indicated with white arrow heads.
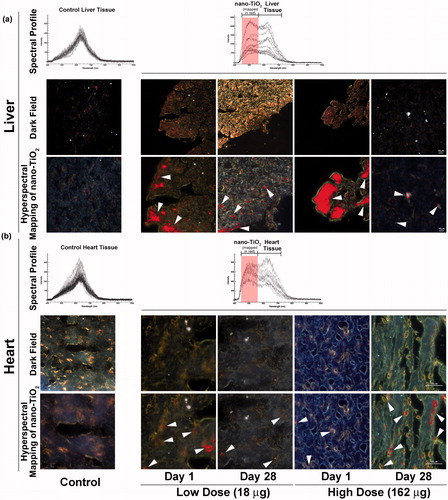
Figure 2. Pathway analysis and RT-qPCR validation of complement cascade genes. (a) Ingenuity pathway analysis shows significant enrichment of complement cascade pathway in the heart tissue 24 h post-exposure. (b) Validation of genes in the complement cascade pathway by RT-qPCR. The statistical significance is noted by **p < 0.01 or *p < 0.05.
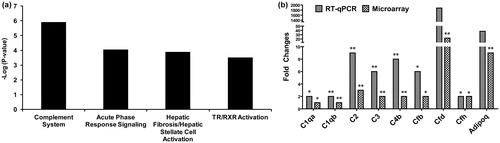
Figure 3. Analysis of proteins by Western blot, ELISA and multiplex protein array. (a) Proteins involved in complement cascade in the heart tissue at 24 h post-exposure were analyzed by Western blot. (b) Pro-inflammatory chemokines and cytokines (CXCL1, CCL2, CCL3, CCL4, IL-1 b, IL-5, IL-10, IL-12 [p40], IL-13 and TNF-α) were analyzed using 23-plex bioplex assay kit; expression of adipsin (CFD) was analyzed using ELISA. The statistical significance is noted by **p < 0.01 or *p < 0.05.
![Figure 3. Analysis of proteins by Western blot, ELISA and multiplex protein array. (a) Proteins involved in complement cascade in the heart tissue at 24 h post-exposure were analyzed by Western blot. (b) Pro-inflammatory chemokines and cytokines (CXCL1, CCL2, CCL3, CCL4, IL-1 b, IL-5, IL-10, IL-12 [p40], IL-13 and TNF-α) were analyzed using 23-plex bioplex assay kit; expression of adipsin (CFD) was analyzed using ELISA. The statistical significance is noted by **p < 0.01 or *p < 0.05.](/cms/asset/9f1e2392-4f35-452d-9b2d-80ec3d5432bf/inan_a_996192_f0003_b.jpg)
Figure 4. Detection of nano-TiO2 in blood of mice exposed to high dose (162 µg) nano-TiO2. Fresh drops of blood from nano-TiO2 exposed or control mice were smeared on microscopic slides using cover slips. Slides were subjected to visible and near-infrared hyperspectral imaging to detect the presence of particles at 24 h post-exposure. The top panel shows the spectral libraries from control (left) and nano-TiO2 exposed (right) samples. The middle panel shows dark field images from control and exposed samples. The bottom panel (right) sample shows hyperspectral mapping of nano-TiO2 in the blood of exposed mice; nano-TiO2 appear as red dots or aggregates.
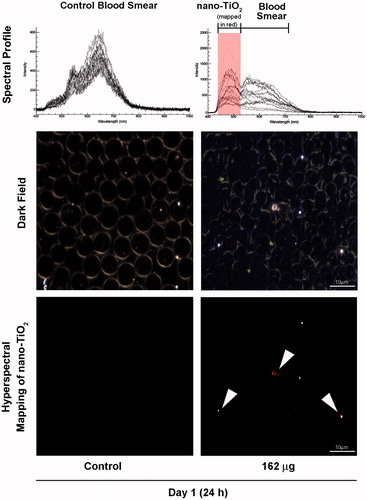
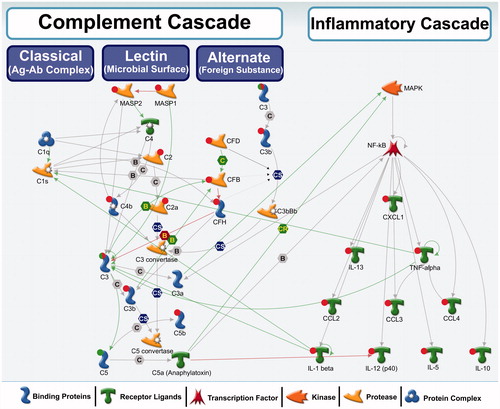
Figure 5. A biological network showing interactions among complement cascade and inflammatory cascade genes/proteins. Red circle: up-regulation, green circle: down-regulation, both red and green: down-regulation of precursor and induction of the activated form. These genes were differentially regulated in this study. No circle: no change in expression or expression levels not measured in this study. Green arrows represent positive regulation/activation, brown arrows represent negative regulation/inhibition and grey arrows represent unspecified regulation. B – binding; C – cleavage; IE – influence on expression; CS – complex subunit; CR – complex group relations.