Figures & data
Figure 1. Experimental design. A combination of 2D-gel based proteomic and MS-based metabolomic approaches was used to analyze the differentially expressed proteome and metabolites of the cytoplasmic compartment of Caco-2 cells exposed to 5 or 30 nm AuNPs (300 μM) for 72 h. Data obtained were interpreted using a combination of bioinformatics tools for a combined omics approach.
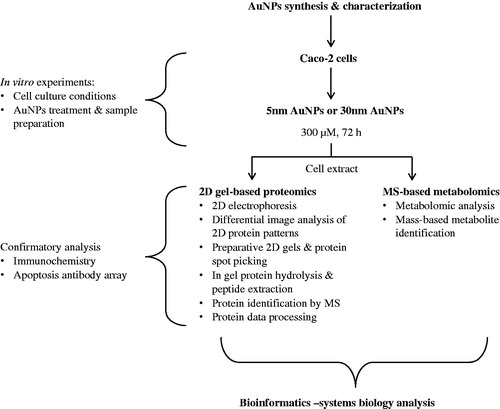
Figure 2. Proteomic analysis of the cytoplasmic extract of Caco-2 cells exposed to AuNPs. Representative two-dimensional gel protein maps of cytoplasmic fractions of (A) untreated (Ctrl), (B) treated with 5 nm AuNPs, and (C) treated with 30 nm AuNPs cells for 72 h. (D) The Venn diagram is showing the distribution of differentially expressed proteins: 5 nm AuNPs versus Ctrl (red circle, 36 proteins), 30 nm AuNPs versus (blue circle, 33 proteins) or 5 versus 30 nm AuNPs (green circle, 23 proteins). Number inside overlapping region of two circles refers to the spots common to different groups (For color figure refer to the online version.)
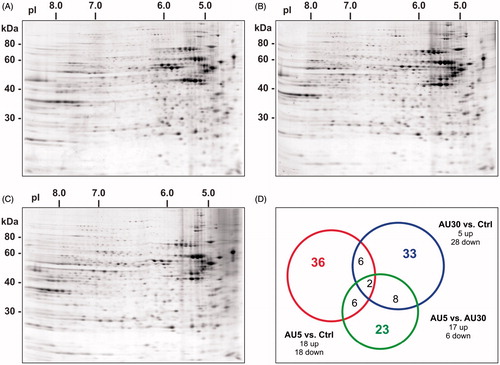
Figure 3. Biological functions altered by AuNPs exposure. Bar charts grouped by biological function representing the differentially expressed proteins and metabolites, after 72 h of treatment with AuNPs. (A) Represents the de-regulated proteins by 5 nm or 30 nm AuNPs and (B) the de-regulated metabolites following exposure to 5 and 30 nm AuNPs.
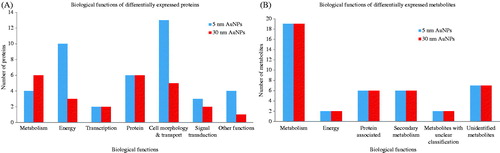
Table 1. List of de-regulated proteins identified in individual 2D gel spots of Caco-2 cytoplasmic extracts.
Table 2. List of de-regulated tentatively annotated metabolites in the cell extract.
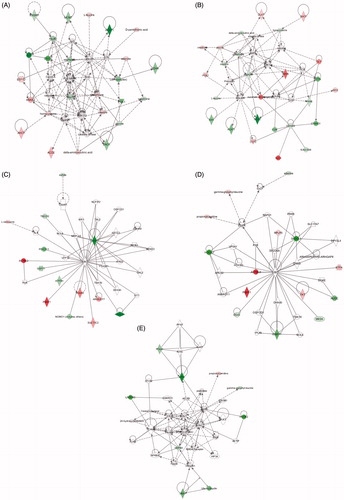
Figure 4. Molecular networks. De-regulated molecular networks in response to 5 or 30 nm AuNPs exposure in Caco-2 cells (300 μM, 72 h). The networks are obtained by analyzing the differentially expressed proteins and metabolites (listed in and ) using Ingenuity IPA. Identified de-regulated proteins and metabolites involved in the network are highlighted in bold. The color indicate the de-regulation (red ![]()