Figures & data
Table 1. Overview of exposure to CuO aerosol. The measured concentration as well as the derived 6 h-concentration equivalents are given per dose group.
Figure 1. Schematic representation of the aerosol generation using the Versatile Aerosol Generator and animal exposure system. Test aerosol sampling for characterization was done 5 cm above the first set of animals.
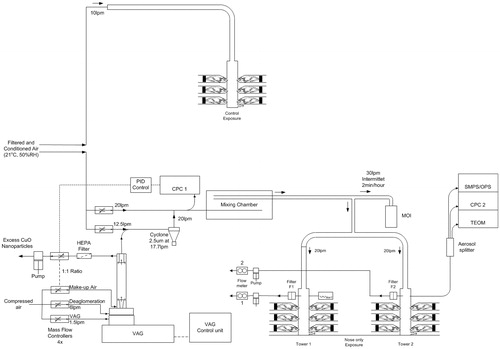
Figure 2. (A) TEM image of nano-sized CuO particles. (B) Particle size distribution of the aerosol (based on multi-orifice cascade impactor data).
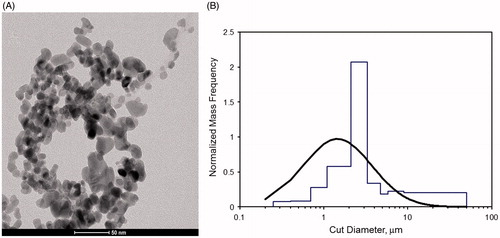
Figure 3. (A) Lung burden (in μg/g organ dry weight) was assessed at day 6, 24 h after the last exposure and after a recovery period of 22 d (day 28) in control animals and animals exposed to 11.6 mg/m3 CuO for 5 consecutive days. The dose levels were calculated and are expressed as 6-h concentration equivalents in mg/m3. p < 0.05 compared with control. (B) Linear relationship for measured lung burden. The burden for the tracheobronchiolar and alveolar region for the highest exposed group is 0.085 mg per total dry whole lung.
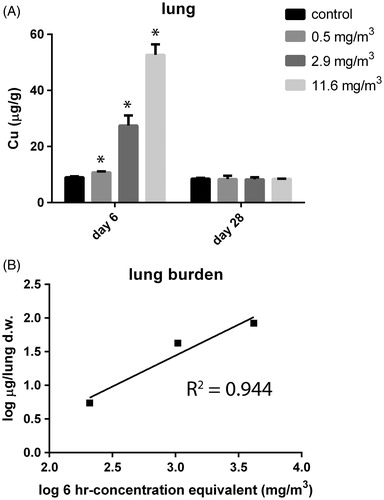
Table 2. Dissolution of CuO nanoparticles in Gamble’s solution and artificial lysosomal fluid (ALF) determined by ICP-OES.
Figure 4. Histopathology of (A) control animal at day 6 with normal olfactory epithelium (10× magnification), (B) degeneration of the nose olfactory epithelium at day 6 at a 6-h concentration equivalent of 13.2 mg/m3 (10× magnification), (C) control animal at day 6 with normal lung alveoli (5× magnification), (D) lung alveolitis at day 6 after exposure to 13.2 mg/m3 (5× magnification), (E) minimal residual inflammatory reaction after recovery period of three weeks 22 d post-exposure to 13.2 mg/m3. Note: cellularity in alveoli and thickened alveolar walls (20× magnification). (F) Minimal residual inflammatory reaction after recovery period of three weeks 22 d post-exposure to 13.2 mg/m3. Note: alveolar macrophages in alveoli at 20× magnification.
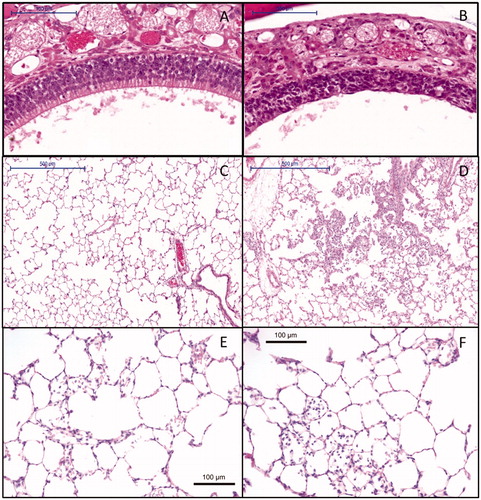
Table 3. BALF parameters mean and sd (n = 5) at day 6 and day 28 after 5 d of exposure.
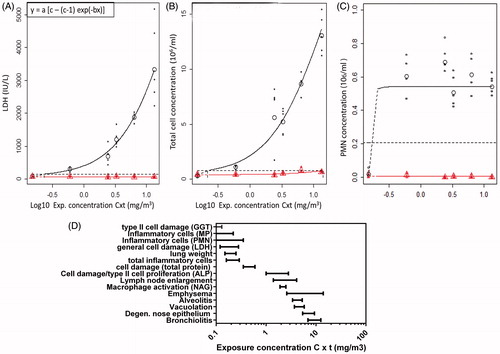
Figure 5. Dose–response curves and summary of BMDs as point of departure for risk assessment and sensitive endpoint analysis. (A) Dose–response curve for the LDH content in BALF in the main group (circles) and recovery groups (triangles). Parameterization: a = 78, b = 34, and c = 148. (B) Dose–response curve for the total cell concentration in the BALF in the main group (circles) and recovery groups (triangles). Parameterization: a = 0.396, b= 14.47, and c= 73.6. (C) Dose–response curves for the fraction of neutrophils in BALF in the main group (circles) and recovery groups (triangles). Parameterization: a = 0.5256, b = 26.77, and c = 0.0846. (D) Summary of the derived BMDs and confidence interval for all endpoints for which a dose–response was found in the main groups. The dose levels are expressed as 6-h concentration equivalents in mg/m3 on a log scale. MP, macrophages; PMN, neutrophils.