Figures & data
Figure 1. Cross-sectional view of HAPS apparatus with model stem in situ and showing sampling sites at the cement mantle-stem interface.
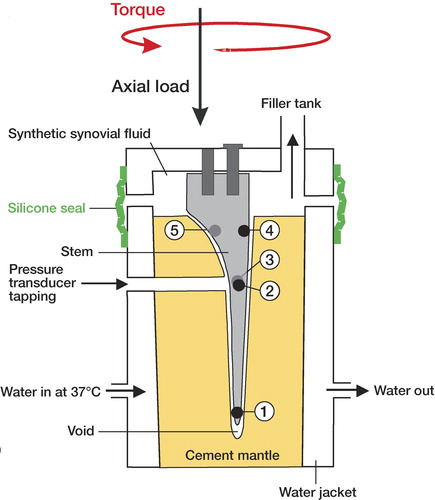
Figure 2. Typical pressure waves generated by a polished stem in a conforming cement mantle at 2 different sites, together with the stem loading schedule. The ΔPmax is the maximum pressure range developed over 1 load cycle (measured in pascals). The typical pressure wave is either dominated by a sine wave (A) or a bi-modal spiked waveform (B). The peaks of the sine wave (arrows 1 and 2) tend not to be synchronized with the peak of the applied axial load; however, the peaks in the bi-modal spiked waveform are synchronised with the torque loading.
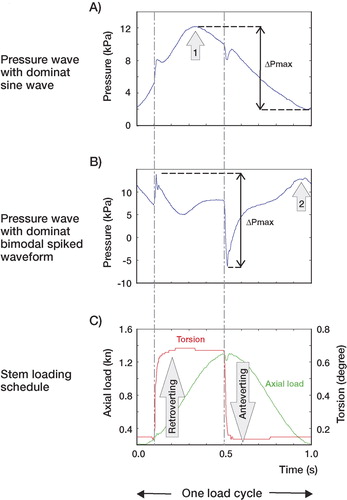
Figure 3. Comparison of the pressure waves of one load cycle generated by polished and rough stems taken at 5 sampling sites at the start of loading (dashed lines) and after 1 million load cycles (solid lines).
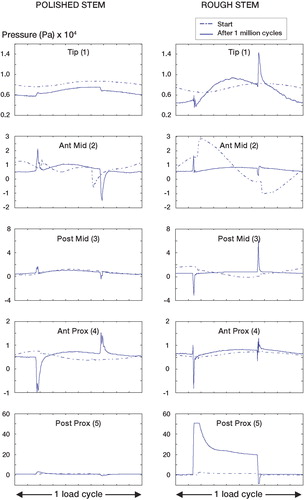
Figure 4. Average of median ΔPmax recorded at the start of the study and after completing 1 million cycles with both polished (A) and rough (B) stems (3 mantles were studied in each group).
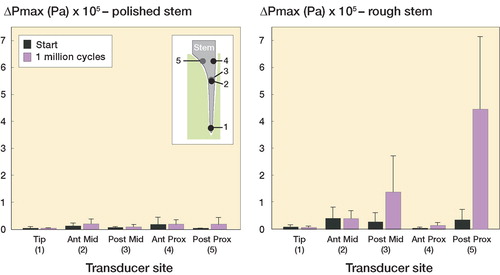
The increase in recoverable rotational and axial micromotion in polished and rough stems between the start of loading and when 1 million load cycles had been completed