Figures & data
Figure 1. Angles describing the orientation of the acetabulum and femoral coverage are calculated from a 3D segmented model of the pelvis in frontal, sagittal, and transverse planes emulating those traditionally measured from radiographs or reformatted CT scans. In the frontal plane (top left), the AC angle measures the obliqueness of the acetabular roof between the medial aspect of the sourcil, the lateral edge of the acetabular rim, and a horizontal line. The CE angle measures the coverage of the lateral edge of the acetabulum with respect to the center of the femoral head (not shown), and may have a negative value in severely dysplastic cases. The orientation of the acetabular cup (S-AC angle) in the sagittal plane (top right) is measured from the most superior aspect of the acetabular roof to the most anterior aspect with respect to horizontal. The anteversion (AcetAV angle) is measured on a transverse plane (bottom left) viewed inferior to superior using a line created between the posterior and anterior rim of the acetabulum. The angle is measured with respect to a line normal to the two femoral head centers (intercapital centerline). The angle measurements help to characterize the orientation of the load-bearing surface of the hip joint in 3 dimensions (bottom right) during realignment (axis scale in mm; viewed isometric from anterio-lateral-superior).
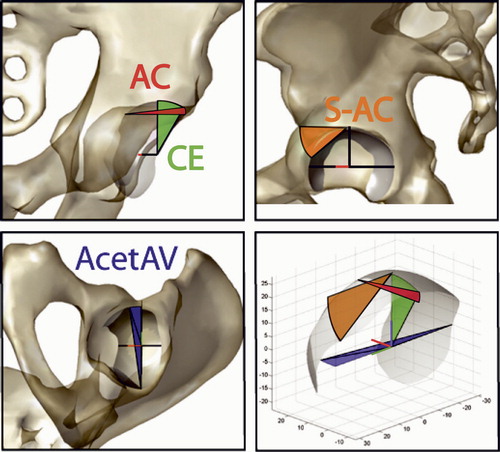
Table 1. Clinical results for the 12 patients
Table 2. Radiological results for the 12 patients. The radiological angles associated with planning of the PAO are listed, including the center–edge (CE), acetabular inclination (AC), superior–anterior angle (S–AC) and acetabular anteversion (AcetAV)
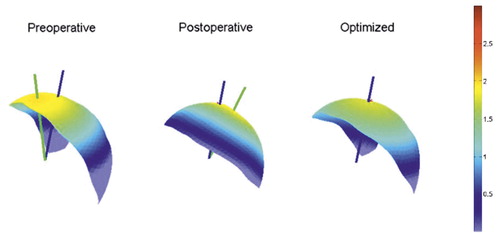
Figure 2. Mechanical results in which the postoperative outcome matched closely with the optimum contact pressure profile (patient 11). The blue line shown passing through the joint contact surface represents the force applied through the hip, while the green line represents the displacement direction of the femoral head. In the optimized case, the lines are collinear. Scale units are MPa.
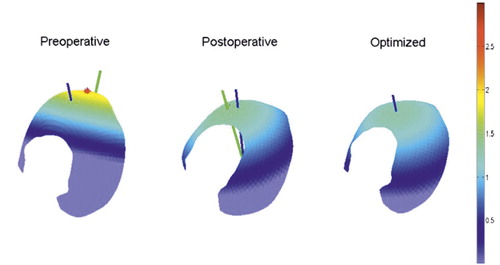
Table 3. Biomechanical and radiological results for the 12 patients. The peak pressure and contact area of the acetabulum are listed. Additional parameters include the centroid of pressure (CP) and the force-displacement separation angle (RU)
Figure 3. An example PAO case in which the postoperative pressure profile indicates overcorrection of the bone fragment (patient 5). The preoperative case shows pressure concentration on the lateral aspect of the joint contact surface. Excessive adduction of the acetabular fragment resulted in medially concentrated pressure postoperatively. Units are MPa.