Figures & data
Figure 1. Collarless double-taper (CPT) stems. A polished stem is shown to the left and a matt-processed rough stem is shown to the right.
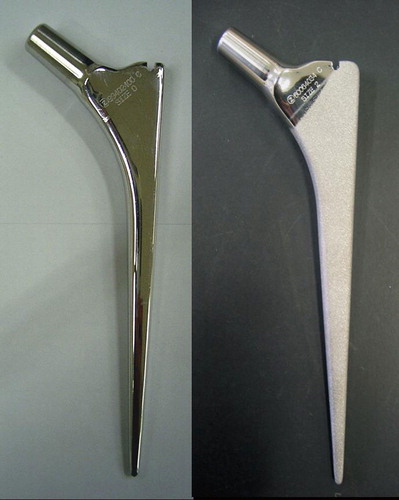
Figure 2. A composite femur fixed in the tester. Rods were set at the cement-bone interface.
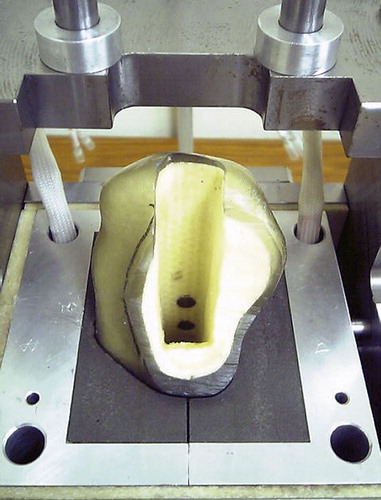
Figure 3. A. An illustration of the tester. The measuring rod (R1 and R2) penetrating the fixator and the femur was placed at the cement-bone interface. Compressive force was measured with the load cell (Lc) via the upper rod (R1) in each site. The amount of cement creep was measured via the lower rod (R2). Stem subsidence was measured with the digital dial gauge (DG) contacting the upper end of the stem. B. The actual tester. The inside was inclined 15 degrees from the base on the coronary plane so that the load was applied to the femur head attached to the top of the stem from 15 degrees inside.
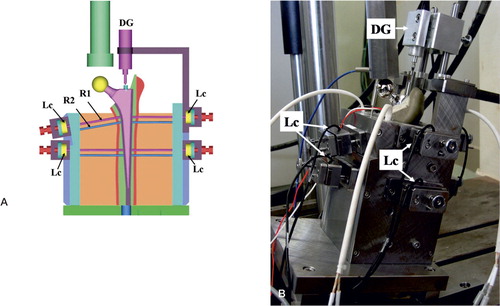
Table 1. Stem subsidence
Figure 4. Compressive forces on the bone-cement interface. PM: proximal medial site; PL: proximal lateral site; DM: distal medial site; DL: distal lateral site.
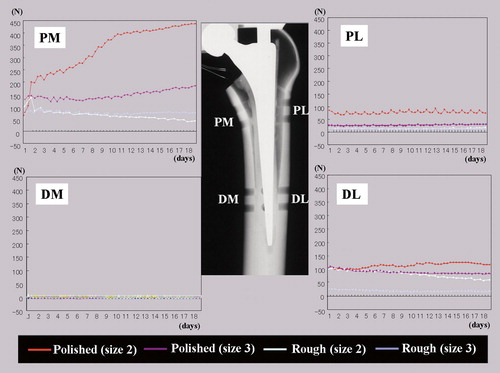
Table 2. Final compressive force and cement creep at the cement-bone interface
Figure 5. Stem subsidence and compressive force at the cement-bone interface. Stem subsidence in each period was defined as the mean of values in the two consecutive files (20,000 data sets) after the start of each period. The compressive force in each period was defined as the mean of the collected 960 maximum values of sine waves in the two consecutive files after the start of each period. 57 (3 periods x 19 days) averaged values were used for analysis of stem subsidence and the compressive force, respectively. Simple regression analysis, significances, and correlation coefficients (r): P2; y = 369.44x – 3.5987, R2 = 0.935, p < 0.001, r = 0.9667. P3; y = 191.92x + 66.66, R2 = 0.536, p < 0.001, r = 0.7322. R2; y = –347.08x + 128.55, R2 = 0.779, p < 0.001, r = 0.8837. R3; y = –244.51x + 138.91, R2 = 0.8633, p < 0.001, r = 0.9291. y: force; x: stem subsidence, R2 = r2.
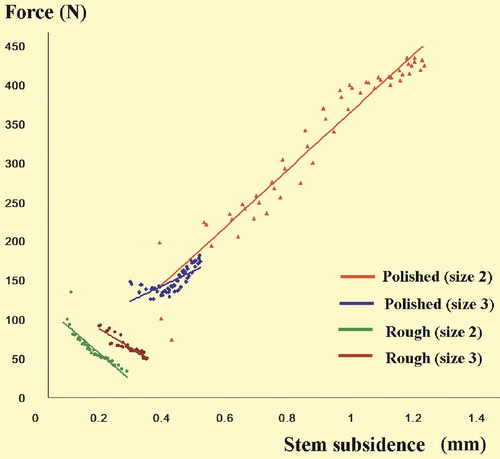
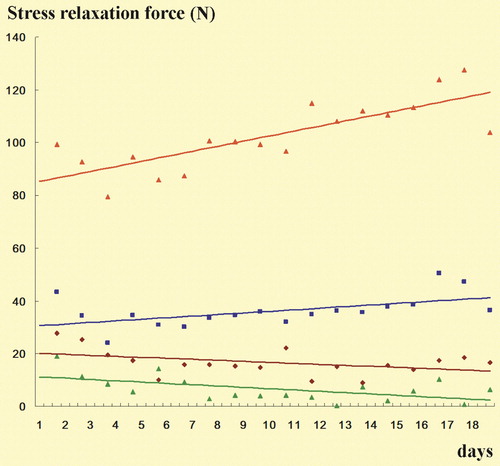
Figure 6. Stress relaxation at proximal medial site. Color codes, see . The stress relaxation value in a day was defined as the difference between the mean of the 960 minimum forces of sine waves in the 2 files collected in the late load period and the mean of the 960 minimum forces in the 2 files collected in the late no-load period. A total 19 values were collected for data in each stem.