Figures & data
Primer sequences for RT-PCR and quantitative RT-PCR
Figure 1. A. Clusters of differentiated adipocytes with typical lipid droplets in cells (black arrow) after treatment with triamicolone acetonide. The green arrow indicates triamicolone acetonide crystals. B. Untreated cells show a spindle-shaped phenotype typical of tendon cells, whereas treated cells totally lose their orientation (right panel). * p < 0.001.
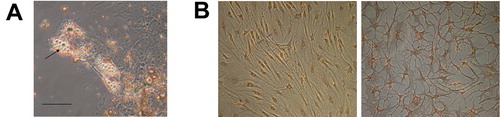
Figure 2. A. Downregulation of collagen type I secretion in TAA-treated supraspinatus tendon cells (STCs) (a: treated cells; b: control). The two separate bands seen in blot A are α1 chain and α2 chain of collagen type I, respectively. B. Sox9 is upregulated in treated cells (d) relative to control cells (c). C. TAA-treated cells show a decrease in 3H-thymidine uptake depending on the duration of TAA treatment. D. After TAA treatment, several cells stained positively for Sox9, whereas no positive cells were found in the control (not shown). * p < 0.001.
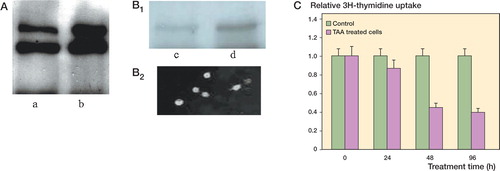
Figure 3. A. Results of gelatin zymography showing the downregulation of MMP2 and MMP9 by triamcinolone acetonide (right lane) compared to untreated control cells (left lane). RT-PCR result showing downregulation of MMP2, MMP8, MMP9, and MMP13 mRNA levels after TAA treatment. B. Levels of MMP1, MMP3, and MMP14 mRNA were unchanged. C. qRT-PCR showed significant downregulation of MMP2 and MMP9 mRNA levels, and significant upregulation of TIMP1 mRNA. Gene expression levels of MMP2, MMP9, and TIMP1 were normalized to the expression of housekeeping genes GAPDH and HPRT. * p < 0.001.
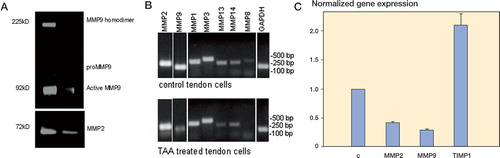
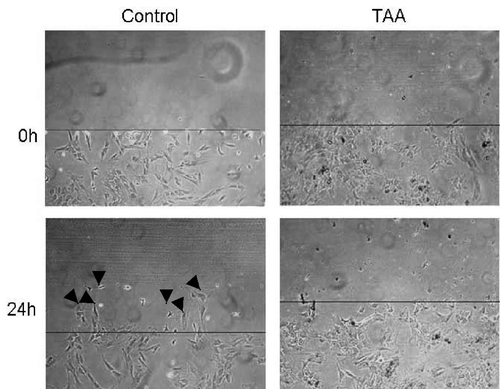
Figure 4. Within 24 h, TAA had totally inhibited cell migration whereas untreated control cells could apparently invade the denuded area (arrowheads).