Figures & data
Figure 1. The impingement test was carried out by passively moving the hip joint in flexion (to 90°), internal rotation, and adduction. The test was regarded as being positive on reproduction of groin pain.
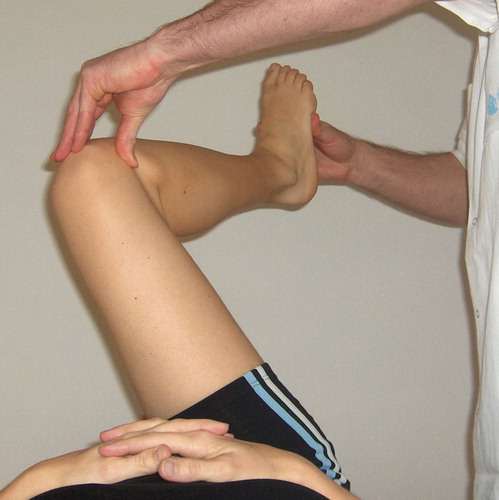
Figure 2. In the FABER (Flexion, ABduction, External Rotation) test, the hip joint was passively flexed, abducted, and externally rotated with the knee flexed (figure-of-four-position). The ankle was brought to rest just above the contralateral knee and slight pressure was applied to the medial side of the knee, approximating it to the examination table. The test was regarded as being positive on reproduction of groin pain.
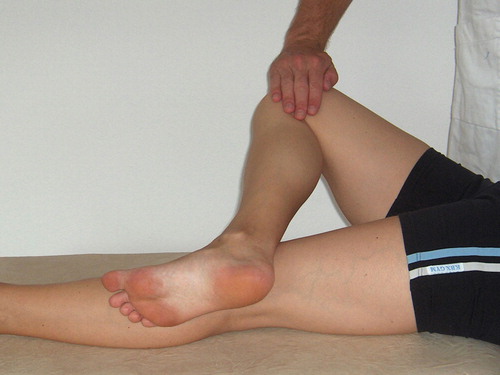
Figure 3. The resisted straight leg raise test. The hip joint was actively flexed to approximately 30° with the knee extended. This position was held by the patient while the examiner applied pressure on the extremity just above the knee, toward the examination table. The test was regarded as being positive on reproduction of groin pain.
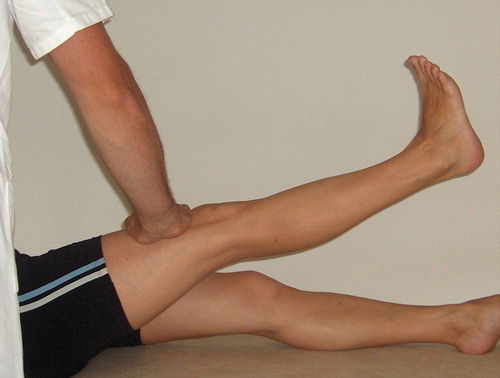
Table 1. Comparison of findings of MR arthrography and ultrasound
Figure 4. An acetabular labral tear visualized by MR arthrography (coronal view) with contrast medium running through the base of the labrum.
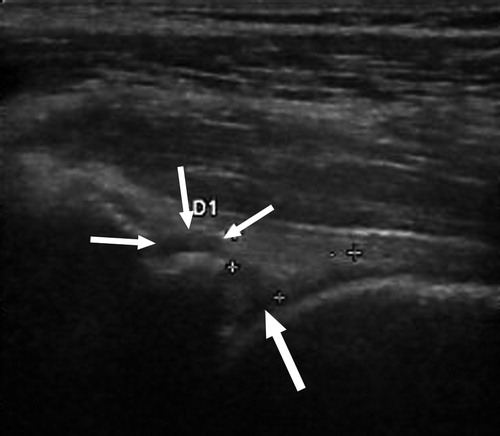
Figure 5. An acetabular labral tear visualized with ultrasound. The crosses mark the approximate limits of the triangular-shaped labrum. The thick arrow points to the hypoechoic cleft that runs through the base of the labrum, ending in cystic formation just superior to the labrum (3 thin arrows).
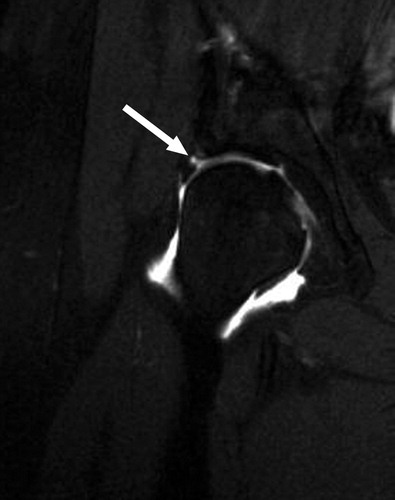
Table 2. Comparison of findings of MR arthrography and impingement test
Table 3. Comparison of findings of MR arthrography and FABER test
Table 4. Diagnostic value of ultrasound and clinical tests compared to MR arthrogra-phy in labral tear diagnostics