Figures & data
Table 1. Characteristics of 30 patients prior to limb deformity correction, and description of their deformities
Graphical representation of the statistical principle of a positive and negative intercept as the result of an intervention in a shortened leg, compared with the normal leg. The length of the normal leg is represented on the x-axis. The length of the shortened leg is represented on the y-axis. The reference line represents the relationship between the lengths of the normal and shortened legs. The relationship between the lengths of normal and shortened legs may change, e.g. by surgical intervention. For better graphical representation, the gain in length from the lengthening procedure is deducted from the length of the shortened leg after the intervention. When the line of proportionate growth shows a changed slope after the intervention, as compared to the reference line, and when this new line has a negative intercept with the y-axis, it represents increased growth of the shortened leg compared to the normal leg. When this new line has a positive intercept with the y-axis, it represents decreased growth of the shortened leg compared to the normal leg.
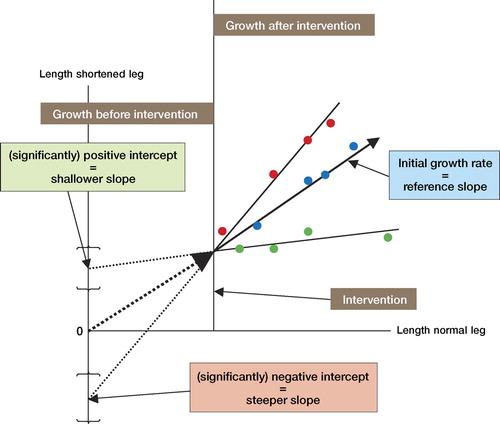
Table 2. The results of limb deformity correction in 30 patients
Table 3. Results of statistical testing using a repeated-measures ANOVA mixed model: significance of the possible treatment factors that may influence the pattern of growth of the limb. The results of significant factors are considered in Table 4
Table 4A. Results of statistical testing using a repeated-measures ANOVA mixed model. The frame configuration has a significant effect on growth pattern. The negative value of a knee-bridging intercept indicates a decreasing proportionate leg length discrepancy, i.e. growth stimulation
Table 4B. Results of statistical testing using a repeated-measures ANOVA mixed model. The location of the osteotomy for the lengthening procedure has a significant effect on the growth pattern. The positive intercept indicates an increasing proportionate leg length discrepancy, i.e. inhibited growth for all types of osteotomy. The tibial osteotomy has significantly less inhibitory effect than other types of osteotomy