1,145
Views
14
CrossRef citations to date
0
Altmetric
Original

Differences in hip bone mineral density may explain the hip fracture pattern in osteoarthritic hips

, , , &
Pages 308-313 | Accepted 27 Nov 2008, Published online: 26 Oct 2009

Figures & data

Figure 1. Zero rotation position (A) and 10–15° external rotation position (B) in bilateral femoral DXA scans. In the latter, the external rotation shows the prominence of the lesser trochanter.

Figure 1. Zero rotation position (A) and 10–15° external rotation position (B) in bilateral femoral DXA scans. In the latter, the external rotation shows the prominence of the lesser trochanter.

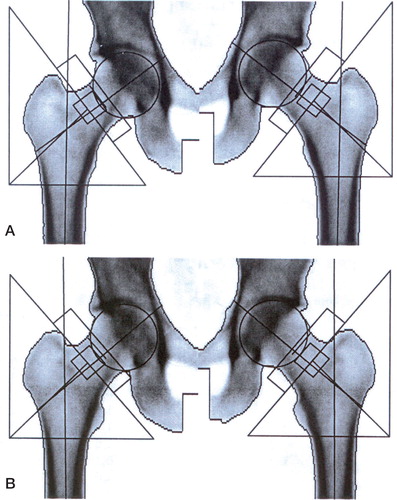
Table 1. Characteristics of patients. Values are mean (SD)

Table 2. Bone mineral density of the proximal femurs and heels, and Z-scores. Values are mean (SD)

Table 3. Bone mineral content and projected bone area at the proximal femur. Values are mean (SD)

Table 4. Body composition of the lower limb measured with DXA for 38 patients with unilateral osteoarthritis of the hip. Values are mean (SD)

Table 5. The effect of rotation of the proximal femur on BMD of the hip (rotation group, 21 patients, 42 hips). Values are mean (SD) in g/cm2

Reprints and Corporate Permissions

Please note: Selecting permissions does not provide access to the full text of the article, please see our help page How do I view content?

To request a reprint or corporate permissions for this article, please click on the relevant link below:

Academic Permissions

Please note: Selecting permissions does not provide access to the full text of the article, please see our help page How do I view content?

Obtain permissions instantly via Rightslink by clicking on the button below:

If you are unable to obtain permissions via Rightslink, please complete and submit this Permissions form. For more information, please visit our Permissions help page.