Figures & data
Figure 3. CRP response after 4 different types of arthroplasty.
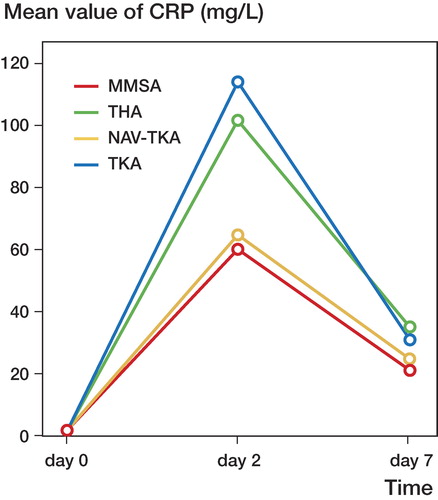
Figure 4. CRP peak levels of 4 types of arthroplasty on the second day. Each box indicates the median, 25, 75 percentiles and minimum and maximum values for each type of arthroplasty.
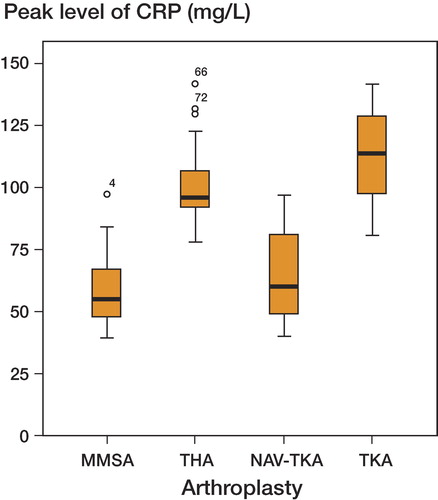
Table 2. P-values for the second postoperative day.