Figures & data
Figure 1. Illustrations of the model. The polyethylene plug transferring load from the tibial cartilage to the implant is not shown. The implant is surrounded by a 0.75-mm gap, and it is loaded during each gait cycle. In addition, there is a constant flow of joint fluid passing the surface. The HA-coated implants were inserted in the left femur and the growth factor-coated implants in the right femur.
Figure 2. Images from histomorphometry. A. hydroxyapatite-coated implant. B. Growth factor-coated implant. The lines indicate the inner and outer zones where the tissue volume is measured. Ongrowth is defined as tissue in direct contact with the implant surface or the hydroxyapatite coating.
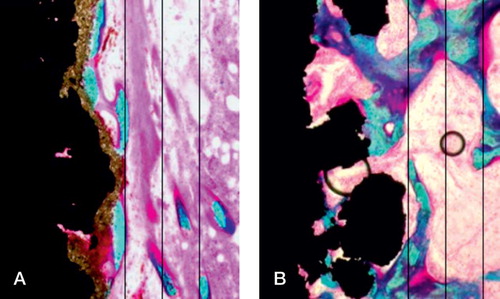
Figure 3. Line plot of maximum shear strength. Paired data are shown interconnected. (p = 0.5).
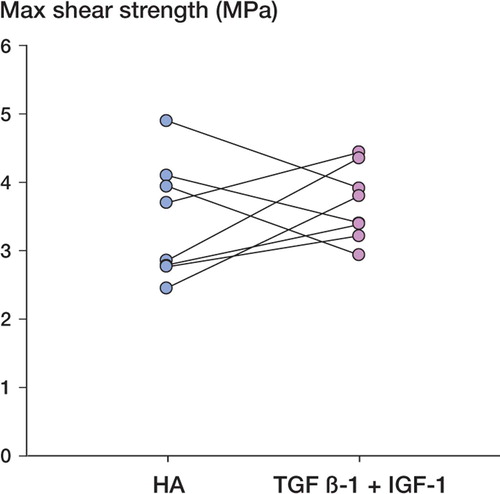
Table 1. Mechanical data (n = 8; 2 excluded). No difference was seen in any of the mechanical parameters (p ≥ 0.23). The data are presented as mean (95% CI)
Figure 4. Graph showing percentage of fibrous tissue on the implant surface (ongrowth), and in the inner gap (p = 0.05). Paired data are shown interconnected. HA: Hydroxyapatite, GF: growth factor.
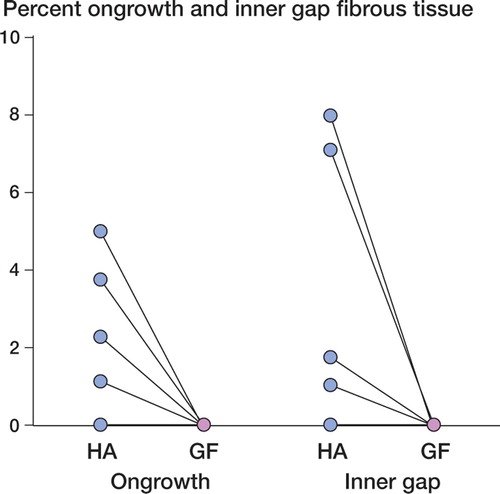
Figure 5. Graph showing the data for the outer zone bone volume (p = 0.03). Paired data are shown interconnected.
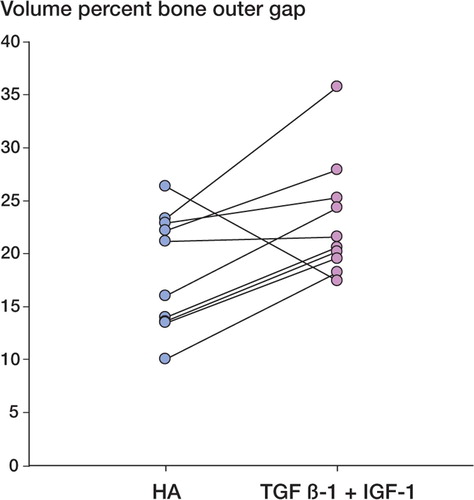
Table 2. Histomorphometric data for bone. Data are presented as mean (95% CI) percentage