Figures & data
Figure 1. Severe degenerative changes.
Figure 2. A Buechel-Pappas type ankle prosthesis in situ.
Table 1. Summary of complications and outcome.
Table 2. Results in relation to the type of implant used.
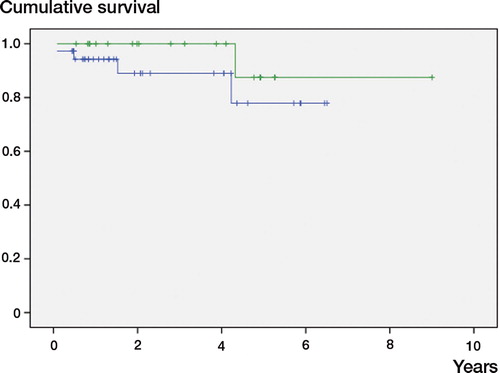
Figure 3. Kaplan-Meier survival curve with removal of the prosthesis as outcome measure. The green line represents the BP prosthesis, the blue line the STAR.