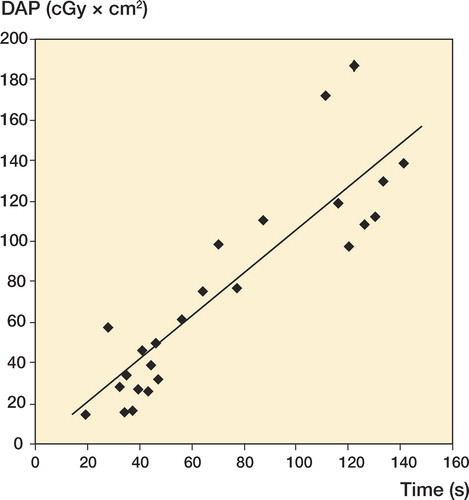
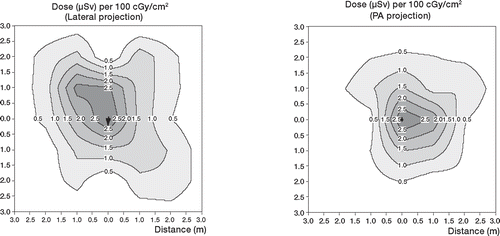
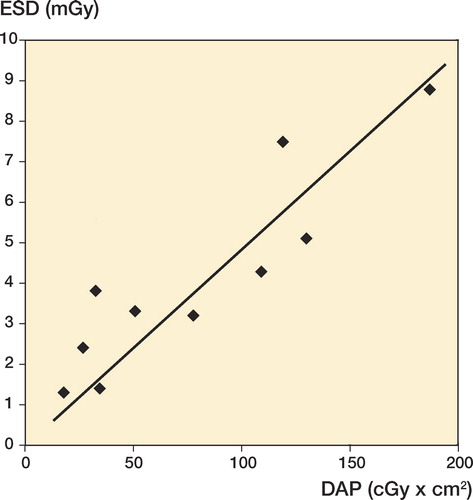
886
Views
29
CrossRef citations to date
0
Altmetric
Research Article

Dosimetry during intramedullary nailing of the tibia

Patient and occupational exposure

, , , &
Pages 568-572 | Accepted 28 May 2009, Published online: 16 Nov 2009

Figures & data

Table 1.  Fluoroscopy time reported in various studies

Figure 1.  Dose area product (DAP) as a function of the total fluoroscopy time.

Figure 1.  Dose area product (DAP) as a function of the total fluoroscopy time.

Figure 2.  Ground plan of the operation room, with the corresponding iso-dose curves (in µSv) at a height of 1 m, for the lateral view (left panel) and posterior-anterior (PA) projection (right panel). The arrow and the cross show the tube direction and position, respectively.

Figure 2.  Ground plan of the operation room, with the corresponding iso-dose curves (in µSv) at a height of 1 m, for the lateral view (left panel) and posterior-anterior (PA) projection (right panel). The arrow and the cross show the tube direction and position, respectively.

Table 2.  TLD results and effective dose for the members of the operating team

Figure 3.  Measured patient entrance surface dose versus DAP values.

Figure 3.  Measured patient entrance surface dose versus DAP values.