Figures & data
Figure 1. Study selection process according to QUOROM (Quality of Reporting of Meta-Analyses) standards.
Table 1. Demographic baseline data
Table 2. Studies included in the meta-analysis, with details of methodology
Figure 2. Forest plot showing that there was no statistically significant difference in mean inclination of cups placed with and without navigational support. Mean effect sizes of individual studies are expressed as squares, with larger squares denoting larger sample sizes, higher precision, and higher relative weight within the meta-analysis. Values lower than zero favor navigation and values higher than zero favor conventional cup positioning. The diamond shows the pooled overall effect size with the 95% confidence interval. When the 95% confidence interval includes the zero, it can be assumed that there is no statistical significance at the two-tailed p < 0.05 level.
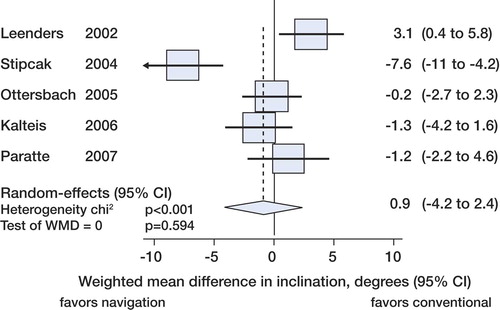
Figure 3. Forest plot showing that there was no statistically significant difference in mean anteversion of cups placed with and without navigational support. No information on anteversion was available in the trial by Leenders et al. (Leenders et al. Citation2002).
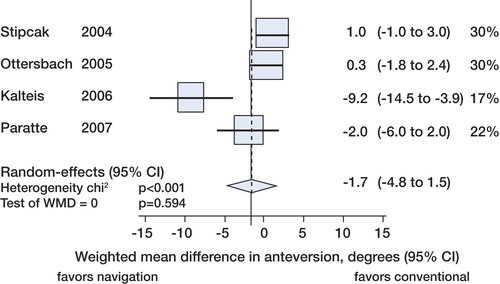
Figure 4. Forest plot showing the statistically significantly reduced relative risk of cup positioning outside the safe zone with navigation.
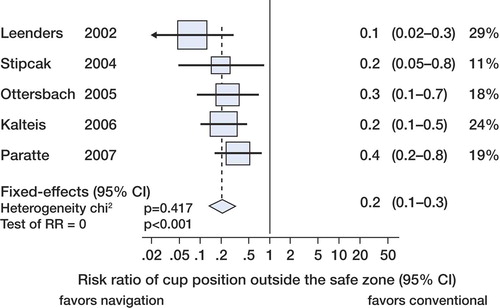
Table 3. Excluded studies