Figures & data
Figure 1. Workstation with a prepared scapula fixed in resin in a screw clamp.
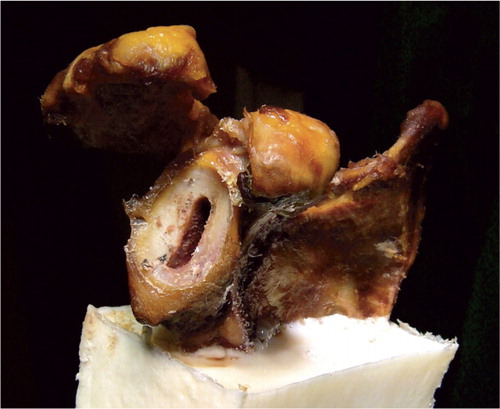
Figure 2. Engineering drawing of the drill jig.
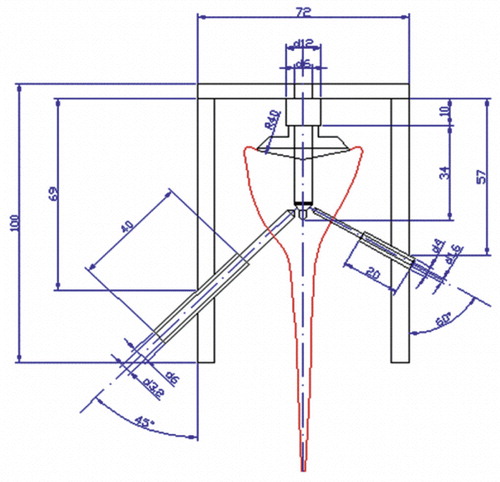
Figure 3. Frontal view of a prepared glenoid with the pressure sensor on the coracoid side and the temperature sensor on the spina side.
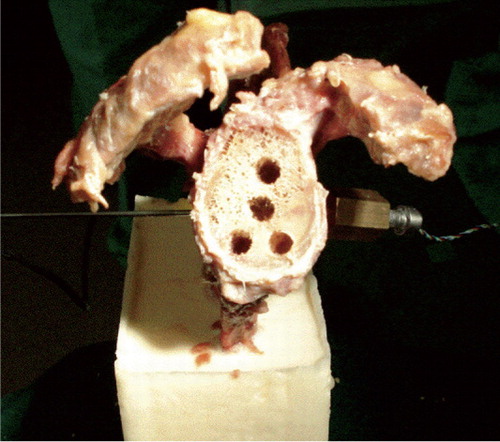
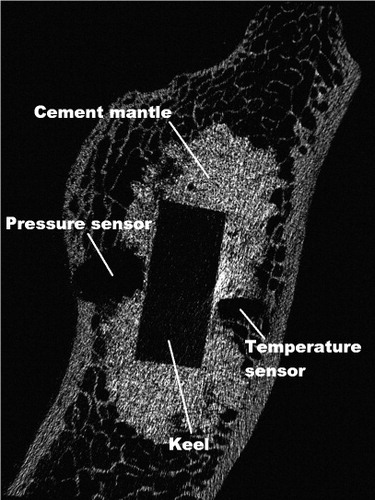
Figure 4. Frontal micro-CT scan of a glenoid cavity showing a continuous cement mantle around the keel. The drill holes where the pressure and temperature sensors were placed are showing that they had direct contact with the cement.
Measurements of the maximum pressures occurring during implantation of the keeled and the pegged components