Figures & data
Figure 1. A. After a medial release (already released in the drawing to the left), when a tensor is inserted in the knee the femur would theoretically exorotate as a result of the loosened medial ligament structure. B. After a lateral release (already released in the drawing to the left), when a tensor is inserted in the knee the femur would theoretically endorotate as a result of the loosened lateral ligament structure.
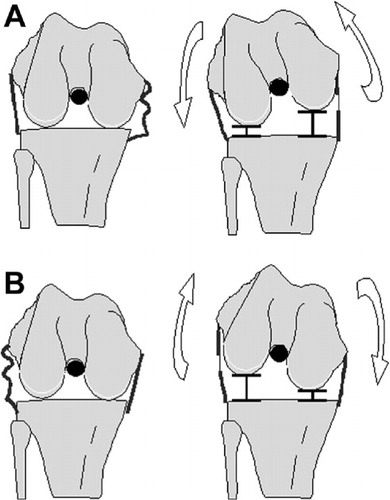
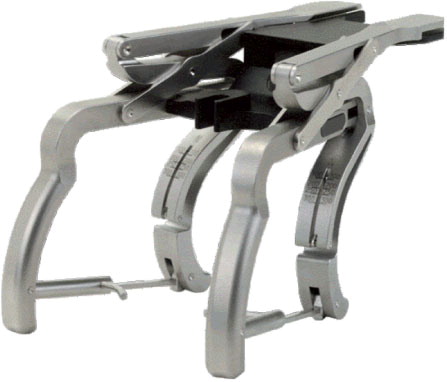
Figure 2. Double-bladed calibrated tensor (balanSys; Mathys AG, Bettlach, Switzerland). A quantified amount of vertically-oriented force can be applied independently to the medial and lateral compartments.
Patient characteristics and median alignment in extension and median femoral rotation in flexion before and after all releases, for the 3 release categories
Figure 3. Box plot of change in leg axis after PMC release (n = 15) and subsequent SMCL release (n = 9) (green boxes, on the left), and after SMCL release (n = 4) and subsequent PMC release (n = 1) (pink boxes, on the right). The median is shown as a horizontal line across each box. The vertical lines represent the minimum and maximum values.
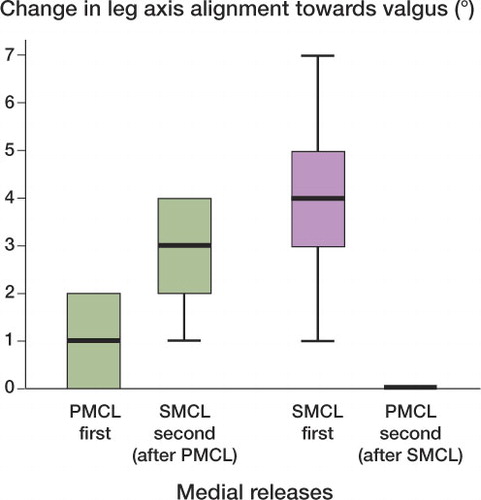
Figure 4. Box plot of change in femoral rotation after PMC release (n = 15) and subsequent SMCL release (n = 9) (green boxes, on the left), and after SMCL release (n = 4) and subsequent PMC release (n = 1) (pink boxes, on the right). The median is shown as a horizontal line across each box. The vertical lines represent the minimum and maximum values.
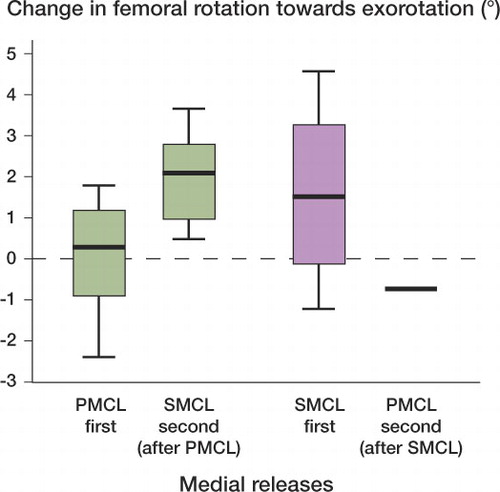
Figure 5. Box plot of change in leg axis after IT release (n = 7) and subsequent PLC (n = 2) or POP release (n = 1) The median is shown as a horizontal line across each box. The vertical lines represent the minimum and maximum values.
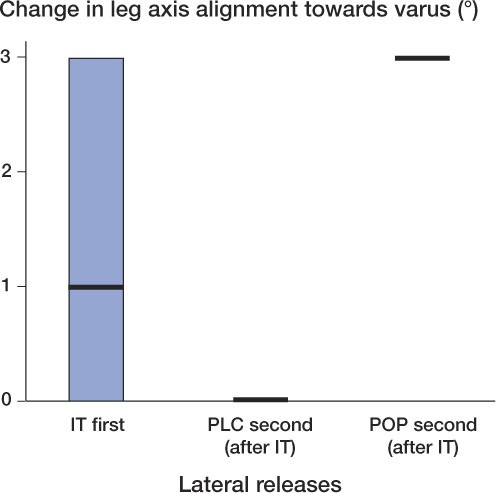
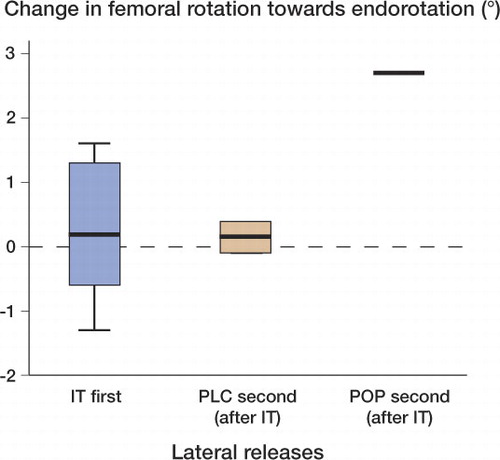
Figure 6. Box plot of change in femoral rotation after IT release (n = 7) and subsequent PLC (n = 2) or POP release (n = 1). The median is shown as a horizontal line across each box. The vertical lines represent the minimum and maximum values.