Figures & data
Figure 1. Flow chart for the study.
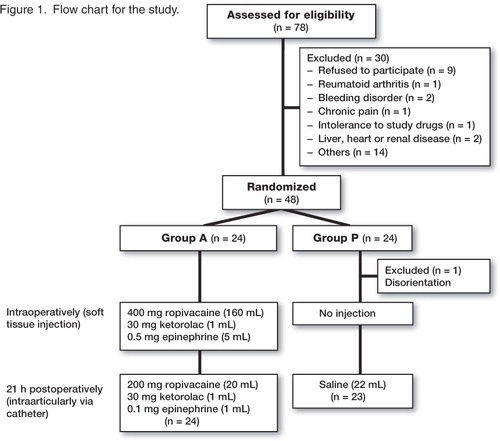
Table 1. Demografic data and duration of surgery. Values are mean (SD)
Table 2. Consumption of analgesics
Figure 2. Postoperative pain at rest. VAS scores are presented as median and interquartile range (IQR). a p < 0.001 (3, 6, and 12 h); p = 0.005 (21 h); p = 0.003 (22 h); p = 0.002 (27 h).
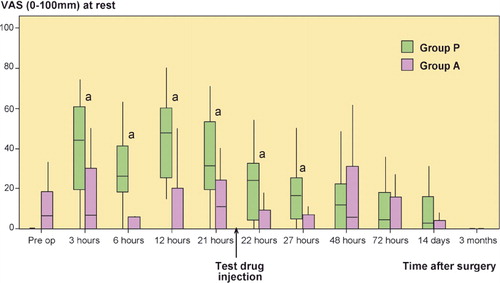
Figure 3. Postoperative pain on movement. VAS scores are presented as median and interquartile range (IQR). a p < 0.001 (3, 6, 12, and 22 h); p = 0.005 (27 h); p = 0.01 (48 h).
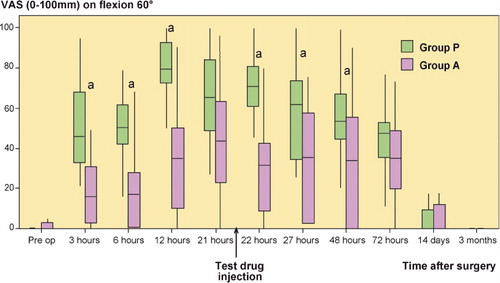
Table 3. Mobilization and patient satisfaction
Table 4. Side effects. Values are number of patients in each category