Figures & data
Figure 1. Lateral view (panel a) and anterior view (panel b) of the tibia showing marker placement in the reference segment. ★ segment A, ▪ segment B, ♦ segment C, ▴ segment D, × segment E, ○ segment F.
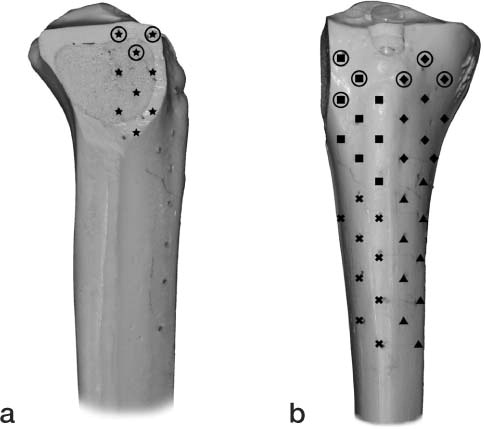
Figure 2. Medial (a) and lateral (b) views of fracture fragment demonstrating marker placement on the fracture fragment. The solid circle represents the fracture segment markers visible after reduction and fixation.
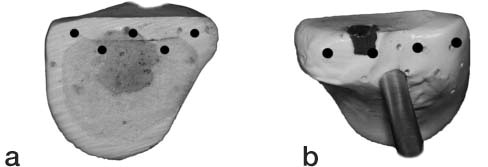
Figure 3. Synbone model of a lateral tibial plateau fracture attached to a translation and rotation stage.
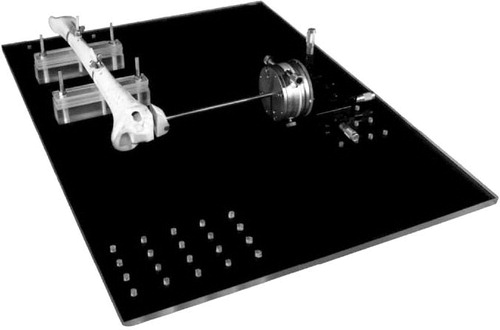
Figure 4. Radiographs of the application of RSA in vivo. Focus 1 (panel a) and focus 2 (panel b).
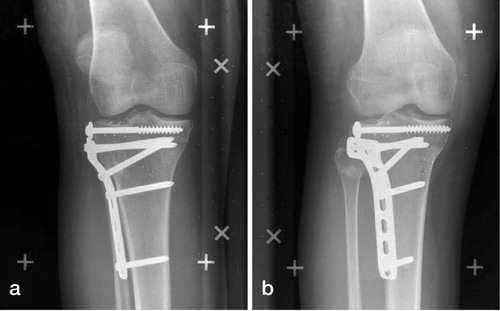
Table 1. Translation accuracy
Table 2. Translation precision
Table 3. Rotation accuracy
Table 4. Rotation precision