Figures & data
Figure 1. The Maxim I-beam stem (A) and cruxiate (finned) stem (B) tibia stem components used (Biomet).
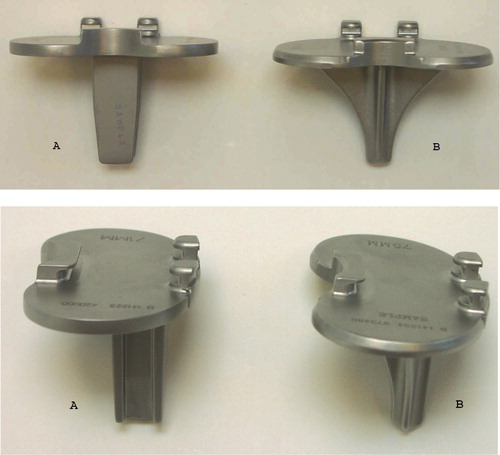
Figure 2. The human phantom bone fixed in neutral flexion on a retrograde nail in a clamp, allowing adjustment of flexion and rotation. Because the scans were made with a “spine program”, we used nylon boards and 2 long rice bags to imitate the soft tissues of the abdomen and loin.
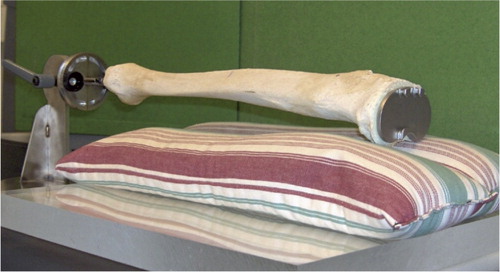
Figure 3. The constructed leg positioner of soft foam for clinical AP scans allowed a reproducible leg position of approximately 25° knee flexion and neutral rotation. The sides of the positioner were filled with rice.
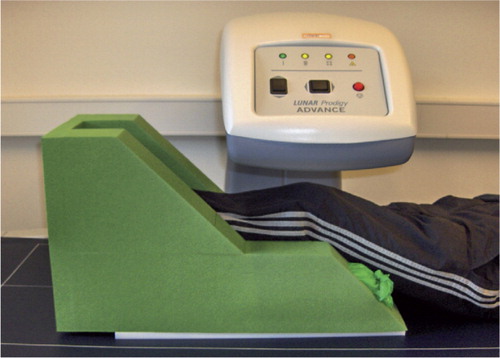
Figure 4. AP densitometry analysis of a right tibia (implant) with software-automated metal removal (blue) and bone-edge detection (yellow line), and manual positioning of the 3-ROI BMD cruxiate stem template. The bone of the fibula was excluded from the analysis.
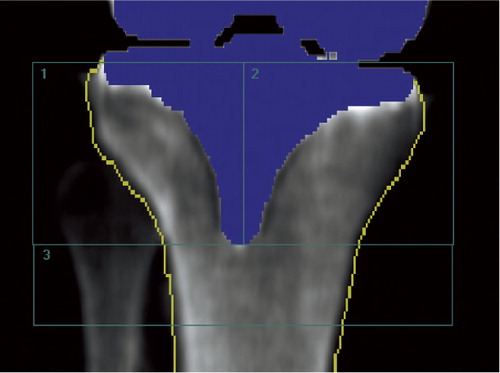
Figure 5. LA densitometry analysis of a right tibia (cruxiate stem implant) with software-automated metal removal (blue) and bone-edge detection (yellow line), and manual positioning of the 3-ROI BMD analysis template. The bone of the fibula was included in the analysis.
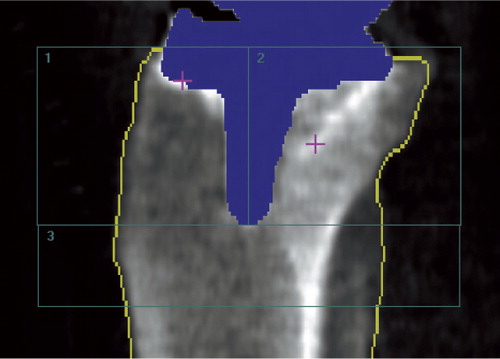
Table 1. Measured periprosthetic BMD (g/cm2)) of the phantom bones with increasing degrees of knee flexion. 5 repeat measurements were obtained for each position. A template of 3 ROIs was used. Values are mean (range) and standard deviation (SD)
Table 2. Repeatability of clinical BMD measurements (double examination)
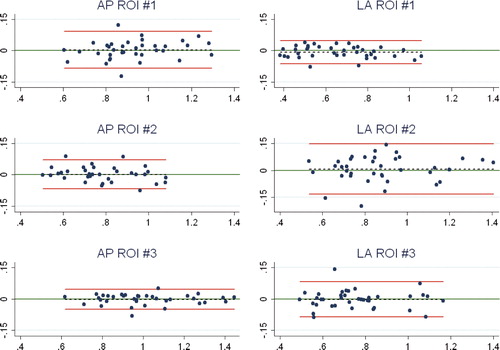
Figure 6. Bland-Altman plot for repeatability (double examinations). X-axis: average of the double measurements; y-axis: difference between double measurements; red lines: 95% limits of agreement; dashed line: bias from 0; long, solid green line: y = 0; dots: individual double values.