Figures & data
Table 1. Patient demographics
Figure 1. Polyethylene wear analysis with the PolyWare software. A. Circles are fitted to the peripheries of the cup and femoral head shadows B. At the end of the analysis a solid cup model is added to the output. Right hips are flipped about the vertical axis to look like left hips prior to analysis.
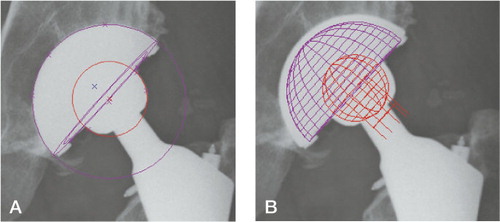
Figure 2. Polyethylene wear analysis in a right hip with model-based RSA, using elementary geometric shape models (EGS-RSA). Spheres are matched by an EGS algorithm to the peripheries of the femoral head and cup, and femoral head penetration is calculated as change in distance between their centers.
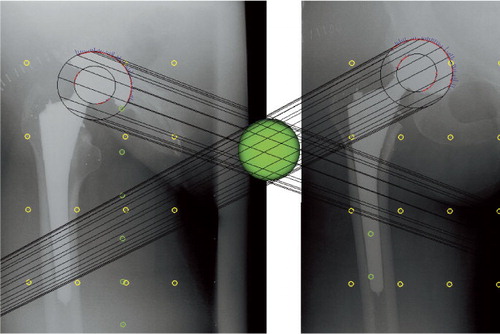
Table 2. Repeatability of radiographic double-examination wear measurements for the 3 methods
Figure 3. Bland-Altman plots and scatter plots, with lines of equality for repeatability measures for each of the 3 methods. Bland-Altman plots (columns 1 and 3); x-axis: average of two measurements; y-axis: the difference between 2 measurements (y = measurement 1 – measurement 2); red lines: 95% limits of agreement; dashed line: bias from 0; solid green line: y = 0 line; dots: individual double measures. Scatter plots (columns 2 and 4); x-axis: first measurement; y-axis: second measurement; maroon lines: lines of equality; EGS-RSA: radiostereometric analysis using sphere models; PW1: PolyWare using only the final follow-up radiographs; PW2: PolyWare using the postoperative and final follow-up radiographs.
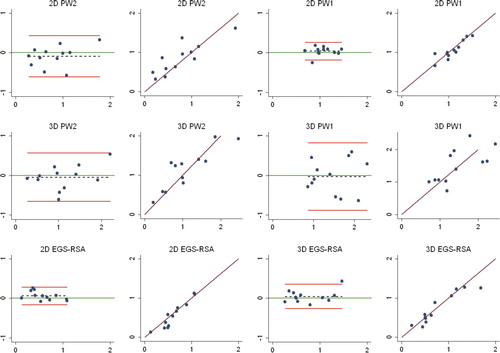
Table 3. Comparison of repeatability and concurrent validity between methods
Figure 4. Bland-Altman plots and scatter plots with lines of equality for concurrent validity between the 3 methods. Bland-Altman plots (columns 1 and 3); x-axis: average of the measurements of 2 methods; y-axis: difference between measurements of 2 methods; red lines: 95% limits of agreement; dashed line: bias from 0; solid green line: y = 0 line; dots: individual double measures. Scatter plots (columns 2 and 4); maroon lines: lines of equality; EGS-RSA: radiostereometric analysis using sphere models; PW1: PolyWare using only the final follow-up radiographs; PW2: PolyWare using the postoperative and final follow-up radiographs.
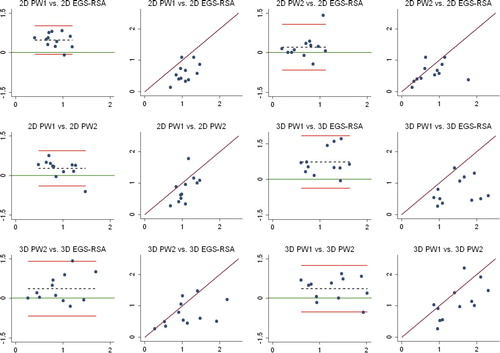
Table 4. Marginal cost analysis in € (euros) for polyethylene wear analysis by EGS-RSA and with PolyWare as used in this study. For easy comparison, the staff costs are listed per patient