Figures & data
Figure 1. The experimental animals gained weight throughout the experimental period similar to that of the control animals. The number of experimental animals at time zero (age 22 weeks) equalled the total number of animals evaluated at the follow-ups (37), since they were all measured preoperatively. The numbers of experimental animals at 12, 24, and 36 weeks were 8, 11, and 18, respectively. The numbers of animals without surgery at time 0, 12, 24, and 36 weeks were 3, 3, 2, and 2, respectively.
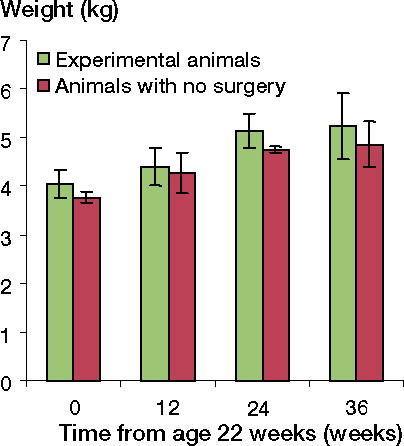
Figure 2. A. The 4-mm chondral defect in the rabbit patella. B. The 4-mm chondral defect in the rabbit MFC.
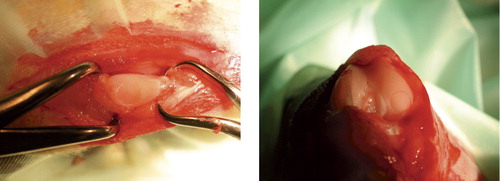
Figure 3. The set-up for surgery. A stereomicroscope ensured the complete removal of all cartilage above the tidemark without harming underlying tissue.
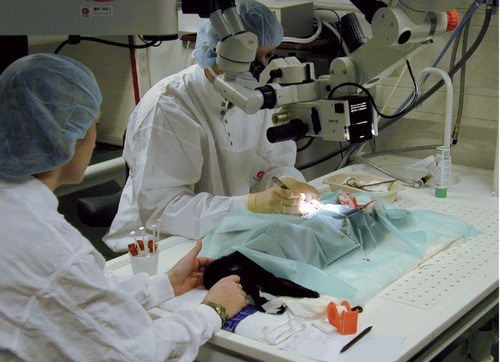
Figure 4. Starting at the rim of the defect, 5 levels of sectioning, each 700 μm further into the 4-mm defect, ensured that a central section would be analyzed.
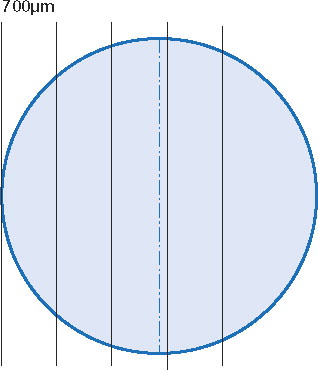
Figure 5. Histological section of a defect in the patella stained with tolouidine blue and photographed at 40× magnification. The section has been modified, highlighting some of the graphics superimposed by the software Analysis Pro. The two green lines outline the height of the shoulders measured. The seven black lines indicate the height of the tissue filling the defect. The yellow lines together with the tidemark frame the area of interest for subchondral mineralized tissue evaluation. The intersections of the red grid are marked with blue circles when overlying mineralized tissue, and with green circles when not.
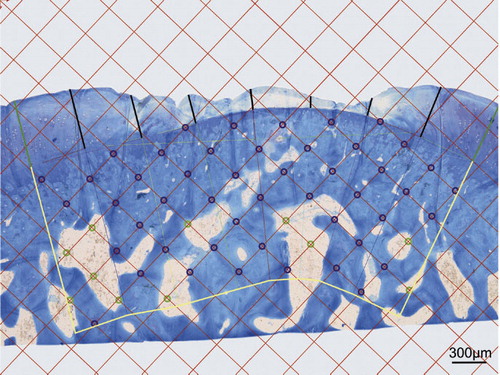
Table 1. The fraction of knees with minor degenerative changes observed macroscopically at follow-up
Table 2. The percentage (SD) of tissue filling in defects. The two locations are compared pairwise at each time point of follow-up, giving the mean differences, the 95% CI, and the p-values obtained by Student t-tests
Figure 6. The percentage filling of the patellar and MFC chondral defects at the different time points of follow-up. For pairwise comparison, the numbers of animals at the 12-, 24-, and 36-week follow-ups were 8, 7, and 17, respectively.
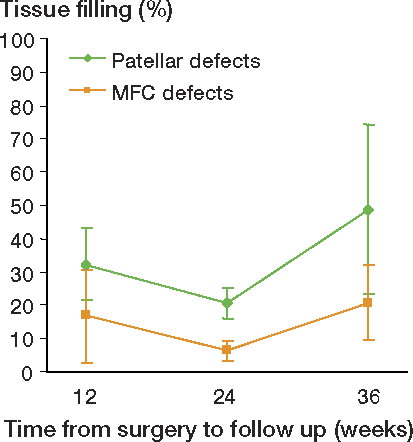
Figure 7. The percentage of subchondral mineralized tissue with time in patellar and MFC specimens. For pairwise comparison, the number of experimental animals at 12, 24, and 36 weeks follow-up were 8, 7, and 17, respectively. The numbers of animals with no surgery sacrificed at the 0-, 12-, 24-, and 36-week time points were 3, 3, 2, and 2, respectively.
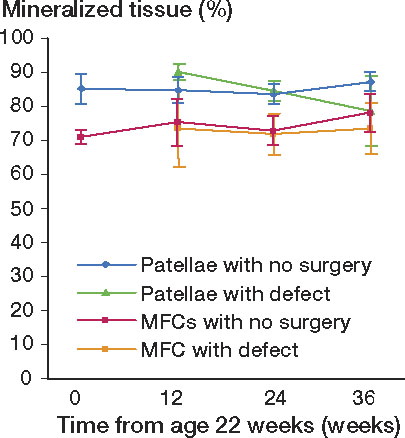
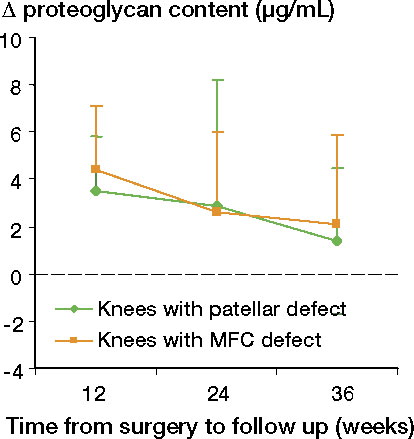
Figure 8. The values of change (Δ) in synovial fluid proteoglycan content from time zero to the different time points of follow up in knees with patellar and MFC defects. The number of animals at 12, 24 and 36 weeks follow up were 8, 7 and 17 respectively.