Figures & data
Table 1. Distribution of outcomes for the three study groups
Figure 1. Estimates of revision by type of prosthesis in patients with FNOF who were aged 75–84 years.
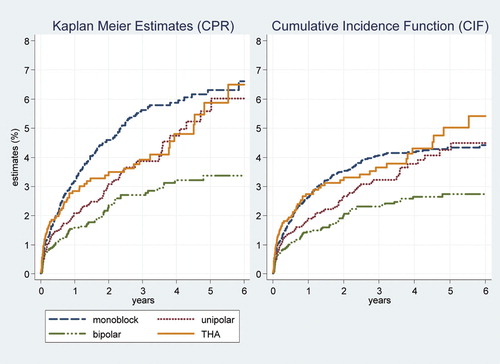
Table 2. Per cent estimates (with 95% confidence interval) of revision in patients aged 75–84 years with FNOF
Figure 2. Estimates of death by type of prosthesis in patients with FNOF who were aged 75–84 years.
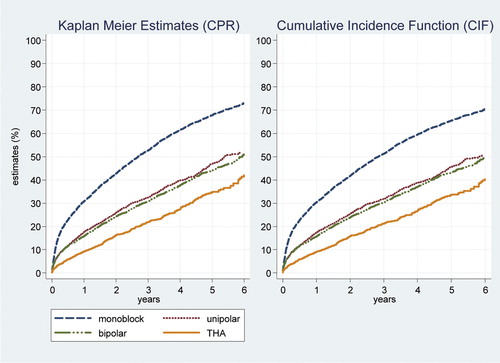
Figure 3. Relative overestimation of KM estimates compared to CIF estimates by years after primary procedure and type of prosthesis; patients were aged 75–84 years with FNOF.
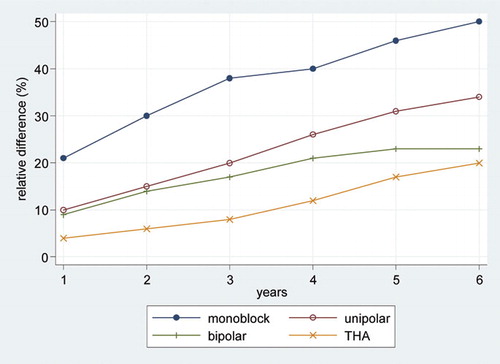
Figure 4. Estimates of revision by type of prosthesis (cementless Austin Moore vs. cemented Thompson) in patients with FNOF.
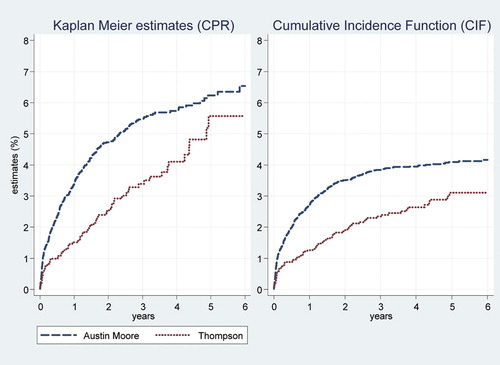
Table 3. Per cent estimates (with 95% confidence interval) of revision in patients with FNOF who received Austin-Moore or Thompson prostheses
Figure 5. Estimates of death by type of prosthesis (cementless Austin Moore vs. cemented Thompson) in patients with FNOF.
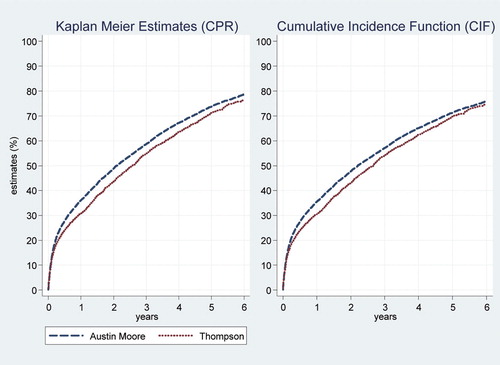
Figure 6. Estimates of revision by age group in patients with OA and THA.
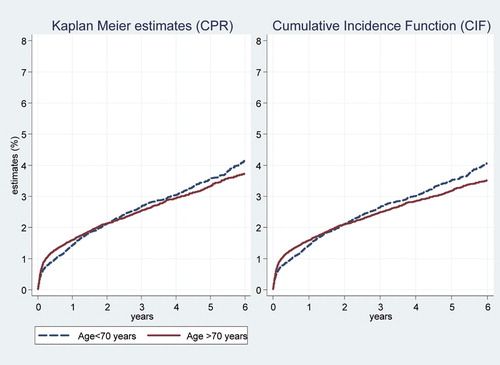
Figure 7. Estimates of death by age group in patients with OA and THA.
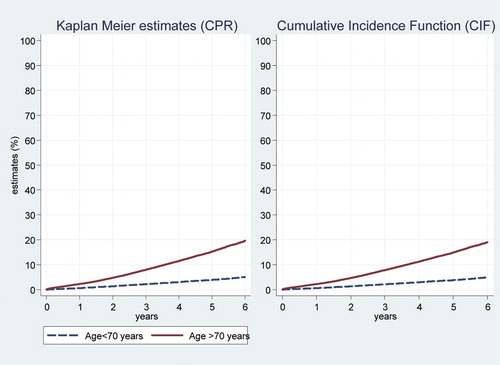
Table 4. Per cent estimates (with 95% confidence interval) of revision in patients with osteoarthritis who underwent total hip replacement–by age group