Figures & data
Figure 1. Radiographic examination of fracture healing in 5-LOKO mice and control C57BL/6 mice. Shown are serial dorsal-ventral radiographs made from a C57BL/6 mouse (column A) and a 5-LOKO mouse (column B) of identical age and genetic background at 7, 10, 14, 21, and 28 days after fracture, as indicated.
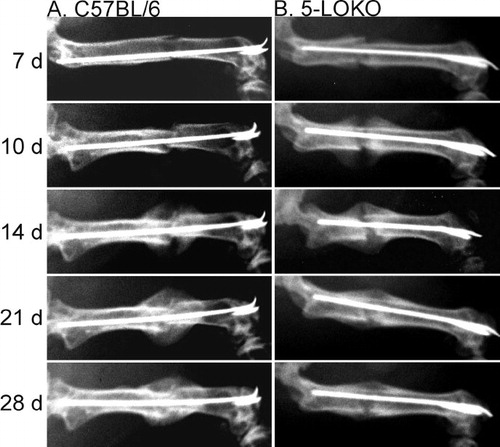
Figure 2. Fractures heal by endochondral ossification in 5-LOKO mice. Shown are fracture callus specimens from control C57BL/6 mice (A), and 5-LOKO mice (B) 7 days after fracture. Specimens were embedded in polymethylmethacrylate, sectioned, and stained with Stevenel's blue and van Gieson's picrofuchsin to identify mineralized tissue (Bn; red) and proteoglycan-rich cartilage (Ca; deep blue). The fracture site (Fx) is in the lower, left quadrant of each image. Digital images were collected at the same magnification and the white bar in panel A corresponds to 500 μm. In the 5-LOKO specimen, a portion of the femoral cortical bone was lost during preparation (M).
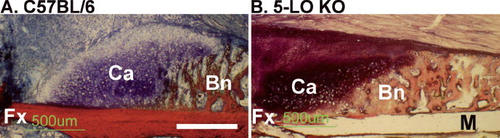
Figure 3. Endochondral ossification is accelerated in 5-LOKO mice. Callus area (A), percent cartilage (B), and percent mineralized tissue (C) were measured for femoral fracture specimens at 7, 10, 14, and 21 days after fracture. Group size was 5 at each time point for the C57BL/6 strain (blue) and 5-LOKO strain (green). Each rectangle represents the 25th and 75th percentiles and the median value is indicated with a line. Differences between the C57BL/6 and 5-LOKO samples are indicated with the corresponding p-values above the x-axis.
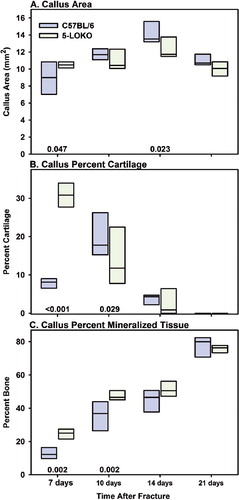
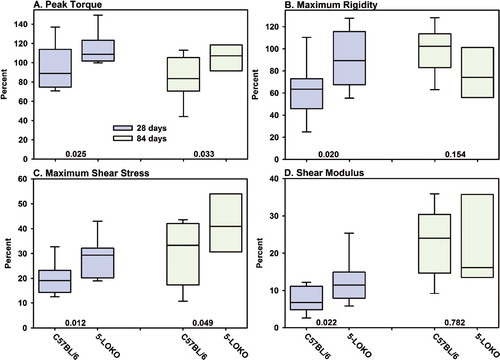
Figure 4. Fracture calluses from 5-LOKO mice have enhanced mechanical properties. Fractured and contralateral femurs after 28 days (blue) and 84 days (green) of healing from control C57BL/6 mice (n = 11 at 28 and 84 days) and 5-LOKO mice (n = 11 and 8 at 28 and 84 days, respectively) were mechanically tested to failure in torsion. Peak torque (panel A), maximum rigidity (panel B), maximum shear stress (panel C), and shear modulus (panel D) were calculated from the torque to angular displacement curves and callus dimensions. Fractured femur values were normalized to values from the contralateral femur of that mouse as a percentage. The limits of each rectangle represent the 25th and 75th percentile of the normalized values. The median value is indicated in each rectangle. The 5th and 95th percentile values are shown below and above each rectangle for those with group sizes of 11. Normalized values were compared between genotypes at each time point and p-values are indicated in each graph above the x-axis.
Contralateral mechanical values for unfractured femurs
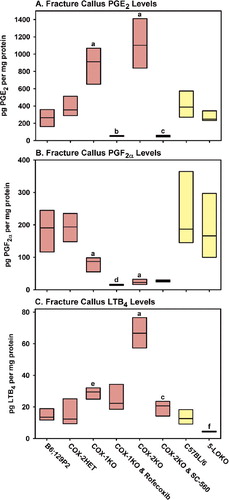
Figure 5. Loss of COX-1, COX-2, or 5-LO function alters callus eicosanoid levels. Rectangles represent the 25th and 75th percentiles with median values shown for fracture callus PGE2 levels (A), PGF2α levels (B), and LTB4 levels (C) measured 4 days after fracture in control B6;129P2 mice (n = 6), COX-2HET mice (n = 6), COX-1KO mice (n = 4), COX-1KO mice treated with 30 mg/kg of rofecoxib (n = 3), COX-2KO mice (n = 6), COX-2KO mice treated with 30 mg/kg of SC-560 (n = 5), control C57BL/6 mice (n = 6), and 5-LOKO mice (n = 6). Significant differences are indicated as a, p < 0.001 vs. COX-2HET; b, p < 0.001 vs. COX-1KO; c, p < 0.001 vs. COX-2KO; d, p = 0.04 vs. COX-1KO; e, p = 0.02 vs COX-2HET; and f, p = 0.002 vs. C57BL/6. Red bars indicate values from mice with the mixed B6;129P2 background and yellow bars indicate values from mice with the C57BL/6 background.