Figures & data
Figure 1. CONSORT flow chart.
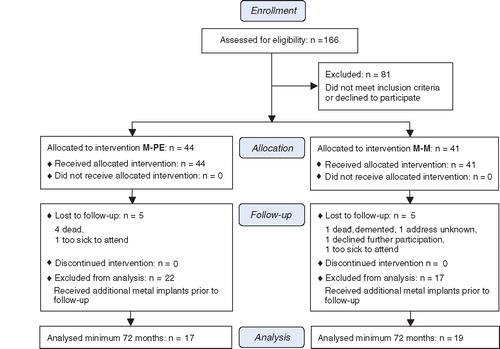
Figure 2. Chromium concentrations in serum prior to and 6 years after hip arthroplasty. Mean and 95% confidence intervals of chromium concentrations (in μg/L).
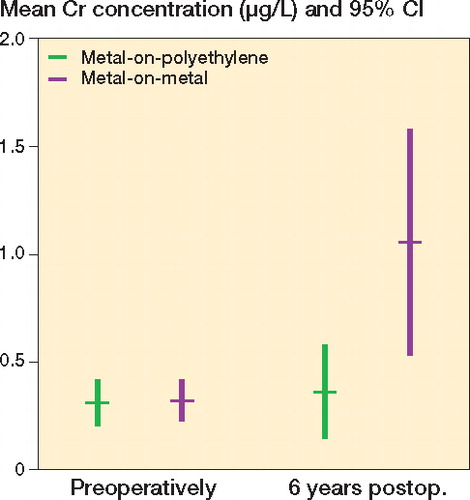
Figure 3. Cobalt concentrations in serum prior to and 6 years after hip arthroplasty. Mean and 95% confidence intervals of cobalt concentrations (in μg/L).
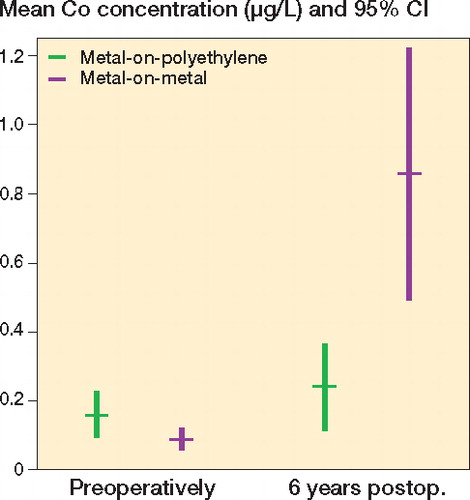
Table 1. Cellular immunological parameters. Mean differences in numbers of leukocytes, lymphocytes, or lymphocyte subpopulations per nL, or percentages of lymphocytes, between the two bearing groups. Positive differences indicate higher values in the metal-on-metal group; negative differences indicate lower values in the metal-on-metal group
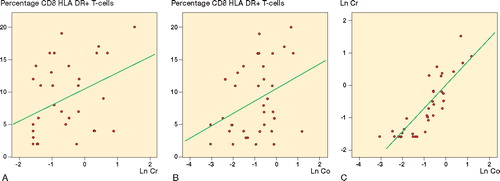
Figure 4. Correlation between the percentage of HLA DR+ CD8+ T-cells and metal ion concentrations after 6 years. A. A positive correlation was found between the percentage of HLA DR+ CD8+ T-cells and logarithmically transformed chromium concentrations after 6 years (Pearson's correlation coefficient: 0.39, p = 0.02). B. A positive correlation was also found between the percentage of HLA DR+ CD8+ T-cells and logarithmically transformed cobalt concentrations after 6 years (Pearson's correlation coefficient: 0.36, p = 0.03). C. Logarithmically transformed cobalt and chromium concentrations were almost linearly correlated with each other (Pearson's correlation coefficient: 0.85, p < 0.001).