Figures & data
Figure 1. Axial (A–D), coronal (E) and sagittal (F) images obtained by low-dose spine CT from 6 patients. A. Normally-placed screw through the right pedicle of T7. B. Screw with total lateral cortical perforation (LCP grade 2) at the level of T9. C. Screw with total medial cortical perforation (MCP grade 2) at the level of L3. D. Pedicle screw with anterior cortical perforation (ACP) with screw tip in close proximity to the posterior-lateral limit of aorta (arrow). This screw was removed a few months later. E. Screw tip perforating the upper endplate of L4 (arrow) on the left side (EPP). F. Screw passing through the lower boundary of the neural foramen (FP) below L3 (arrow).
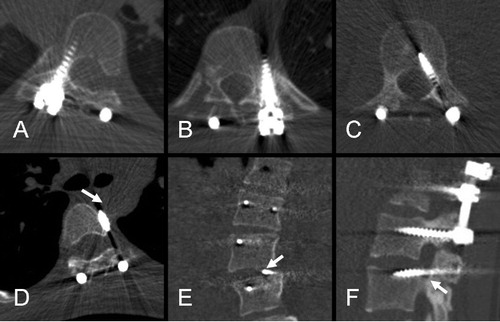
Table 1. Rate of different types of screw misplacement assessed in the study
Figure 2. A. Scatter plot showing the results of the linear regression: patient number (date of operation) against the misplacement rate (R2 = 0.12). B–D. Line graphs showing the misplacement rate for different study periods: B. Misplacement rate for all types of misplacement. C. Rate of lateral cortical perforation (all LCP, LCP grade 1, and LCP grade 2). D. Rate of medial cortical perforation (all MCP, MCP grade 1, and MCP grade 2). Periods 1–4 indicate patients operated during 2005–2006, 2007, 2008, and 2009, respectively.
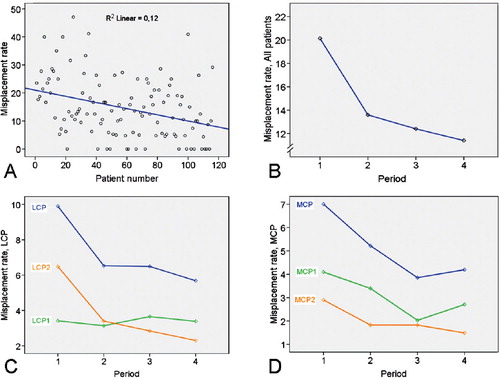
Table 2. Rate of misplacement per patient: Student's t-test to find out if there was a breakpoint at the end of the first period, i.e. at the end of 2006 compared with the period 2007–2009
Table 3. Chi-square test of association between the occurrence of screw misplacement and different categorical variables
Table 4. The number of screws inserted, the number of the level fixed, and the rate of screw misplacement in relation to different types of scoliotic curves (according to the Lenke classification)