Figures & data
Figure 1. Design of the custom-made proximal stem centralizer.
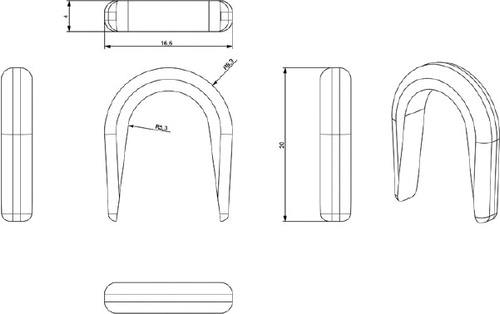
Figure 2. Femoral components. A proximal centralizer on the left stem (investigational group) and distal centralizers on both stems.
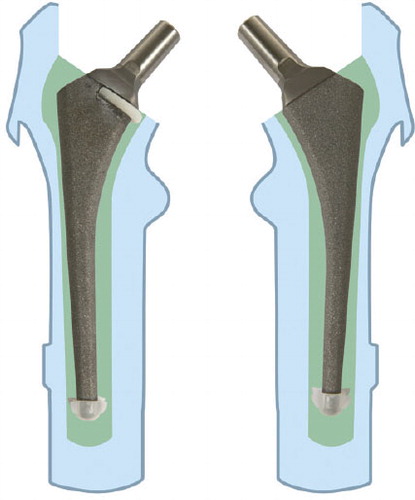
Figure 3. A. Schematic illustration of the positions of the pressure transducers and pressure recorder. B. A typical pressure profile during cementation is shown. Small elevations in pressure at the start of the curves correspond to cement application and pressurization whereas large peaks are related to stem insertion. 0 on the x-axis corresponds to cement application into the canal.
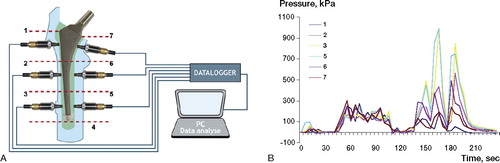
Figure 4. The axes of implant and femoral canal on both coronal (A) and lateral projections (B). Red line: axis of the femoral stem; blue line: femoral axis.
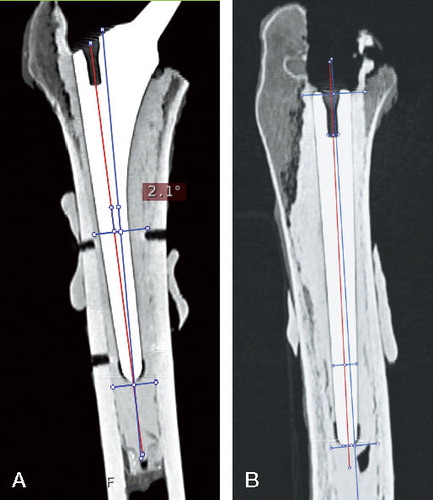
Figure 5. The nucleator with 8 intercepts defining 8 regions of interest (ROIs) on the cross section of the left femur. AL: anterior-lateral; A: anterior; AM: anterior-medial; M: medial; PM: posterior-medial; P: posterior; PL: posterior-lateral; L: lateral.
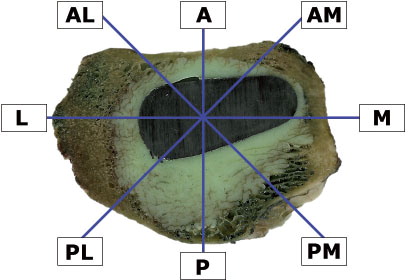
Figure 6. Peak pressure recordings during stem insertion. Measurements at the medial and the lateral zones belong to the same region.
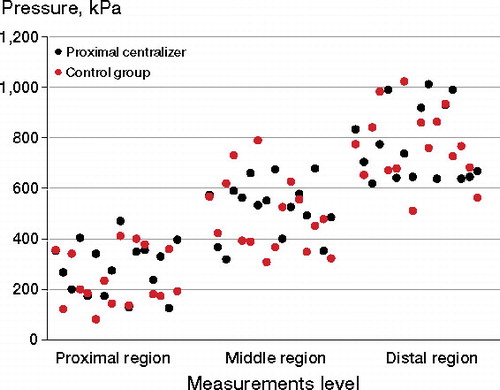
Table 1. Peak pressures at the proximal, middle, and distal regions attained during stem insertion
Figure 7. Mean cement penetration at 8 ROIs. The error bars represent SD. For abbreviations, see Figure 5.
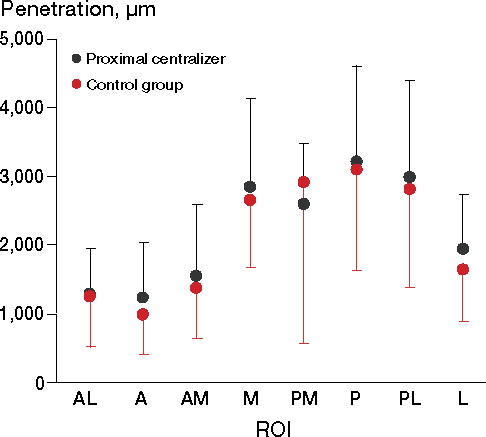
Figure 8. The thickness of the whole cement mantle and of the pure cement mantle in both groups. The error bars represent SD.
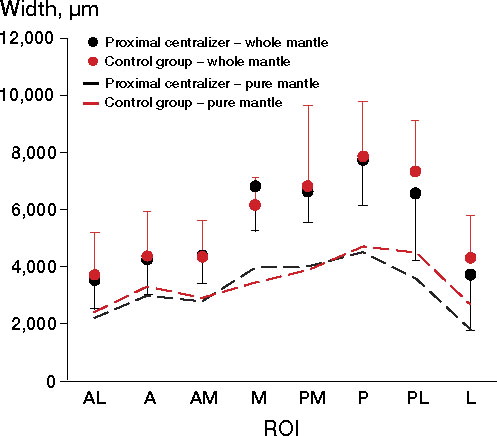
Table 2. Median deviation from the femoral axis (interquartile range), in degrees a
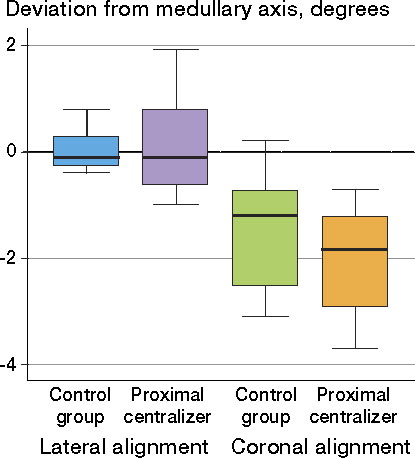
Figure 9. Data regarding stem alignment on coronal and lateral projections in both groups. The wiskers represents the lower and the upper adjacent value. Lower adjacent value = is the smallest value above the lower inner fence which is calculated by the formula: 25th percentile –1.5 x (75th percentile – 25th percentile).