Figures & data
Table 1. MRI measurements by 3 observers (A, B, and C) of minimal dural sac area (mm2) in a randomly selected subset of 20 patients
Table 2. Patient demographics, EQ-5D, VAS leg and back, minimal dural sac area, and multilevel stenosis. Values are mean (SD)
Table 3. The relationship between minimal dural sac area and multilevel stenosis on the one hand and functional status, pain, and EQ-5D on the other
Table 4. Comparison of EQ-5D, functional status, and pain in patients with single and multilevel stenosis. Values are mean (SD)
Plot of leg pain against the number of stenotic levels.
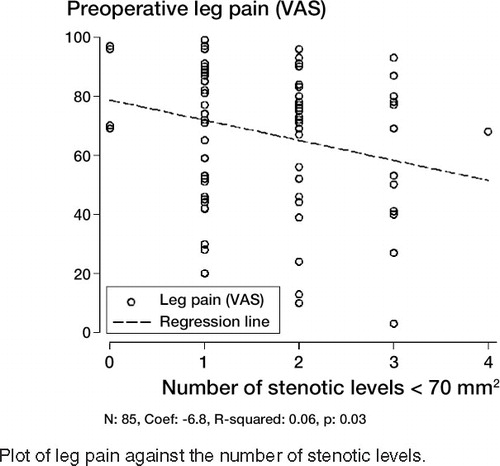
Table 5. Age, minimal dural sac area, multilevel stenosis, and HRLQoL in patients with and without spondylolisthesis. Values are mean (SD)