Figures & data
Table 1. The coefficient of variation (CV%) of the BMD measurements in different Gruen zones and overall
Figure 1. Changes in bone mineral density (BMD) in different regions over the first 14 days after insertion of an uncemented femoral stem. Results are medians, given as percentages of the first postoperative value.
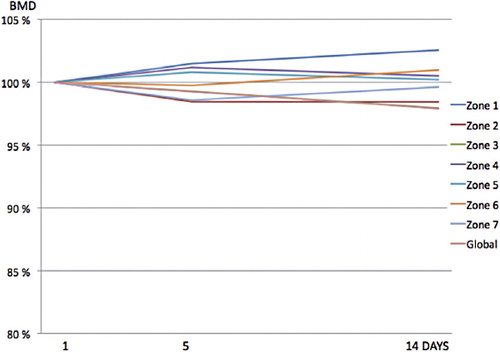
Table 2. Median bone mineral density in different regions after insertion of an uncemented femoral stem. Results are percent (range) after 5 days, 14 days, 3 months, and 12 months
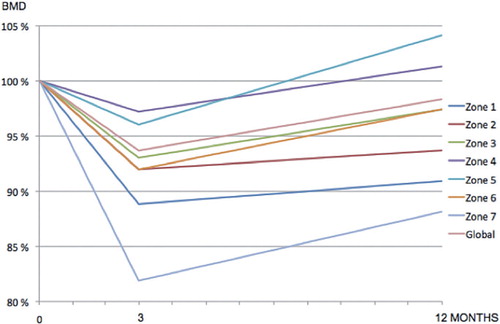
Figure 2. Changes in bone mineral density (BMD) in different regions during the first year after insertion of an uncemented femoral stem. Results are medians, given as percentages of the first postoperative value.