Figures & data
Figure 1. The AD coating was attached to the titanium implants with the filtered, pulsed plasma arc-discharge method (Lappalainen and Santavirta Citation2005).
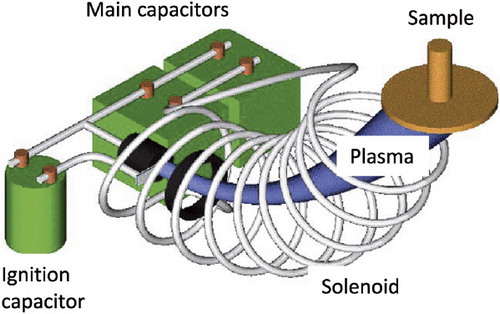
Figure 2. The operation. Drilling of the hole between the femoral condyles into the bone marrow cavity (a) and insertion of the implant (b). See text for details.
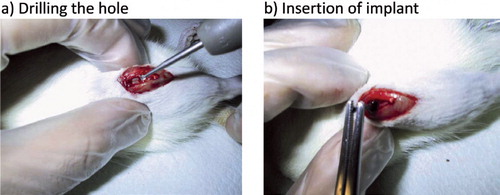
Figure 3. Representative examples of light microscopic images of non-coated (a, c) and AD-coated (b,d) titanium implants in rat femurs 12 weeks after the surgical procedure. In this example, the new bone layer is much thicker on the AD-coated implant surface than on the non-coated implant surface. Toluidine blue was used for staining. It is noteworthy that a fibrous capsule was not visible on the AD-coated implants. 2 × magnification (a, b) and 10 × magnification (c, d).
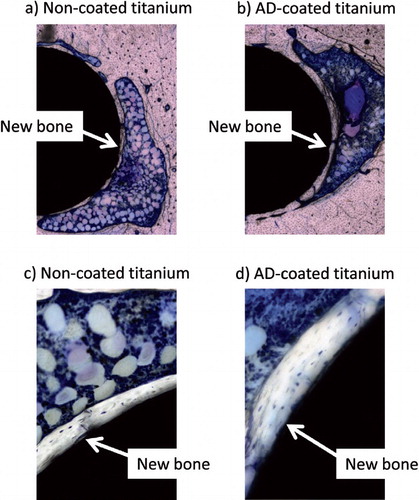
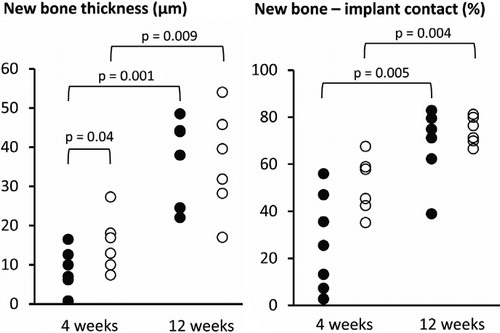
Figure 4. Thickness of new bone layer on the implant surface (left) and percentage of implant surface covered with new bone (right) for non-coated (•) and AD-coated (○) titanium implants 4 and 12 weeks after surgical operation. Each data point is shown, and statistically significant differences between the groups and time points are indicated.