Figures & data
Table 1. General patient characteristics (n = 347), medical history, and comorbidities
Table 2. Mean profiles of CRP and leukocyte values preoperatively and postoperatively
Figure 1. Kinetics of postoperative CRP levels (mg/L): fusion (n = 150) vs. nucleotomy (n = 197). Values are mean and standard deviation.
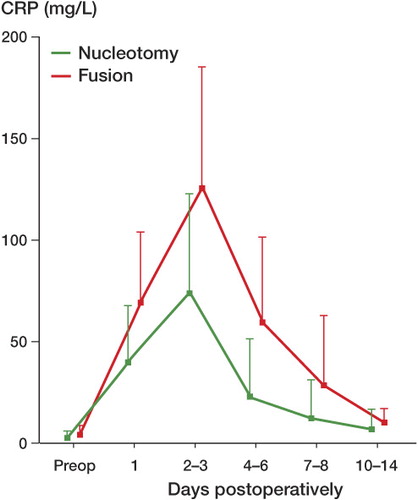
Figure 2. Kinetics of postoperative white blood cell count (g/L): fusion (n = 150) vs. nucleotomy (n = 197). Values are mean and standard deviation.
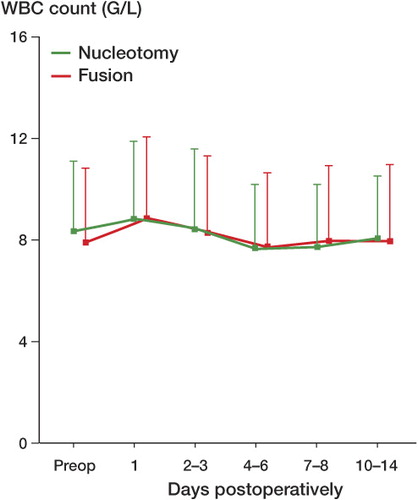
Table 3. Multiple regression analysis of peak values of CRP and leukocyte profiles for all patients (n = 347)