Figures & data
Table 1. Patient demographics with pre- and postoperative measurements
Figure 1. Treatment flow chart for brachial plexus birth injury with poor active external rotation. GHJ = glenohumeral joint.
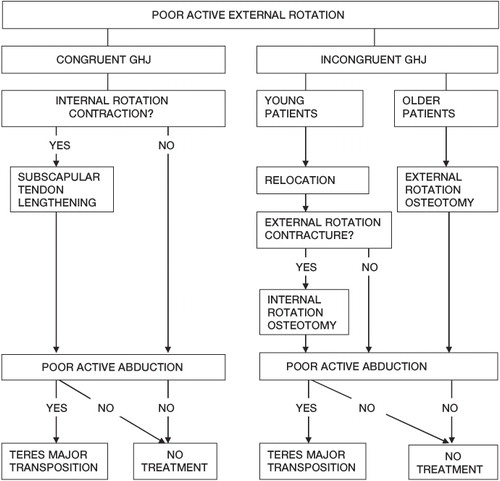
Figure 2. Schematic image showing the measurement of glenoscapular angle (GSA) and the percentage of humeral head anterior to the middle of the glenoid fossa (PHHA): i.e. (AB/AC) × 100%.
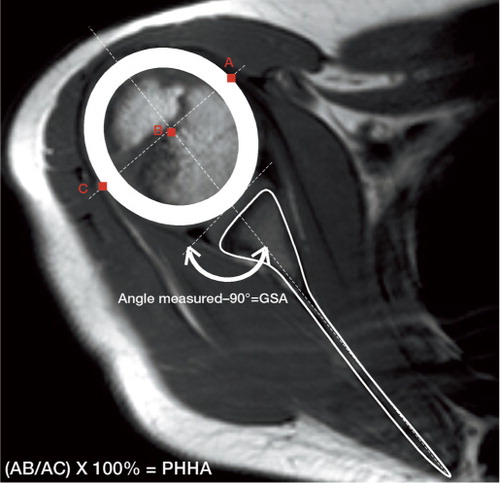
Figure 3. Axial T1-W images of the right glenohumeral joint of a boy with BPBI-related restricted external rotation. Relocation operation performed at the age of 4 years. a) Preoperatively: pseudoglenoid with severe retroversion of the right glenoid fossa, GSA = -55°; PHHA = 7% at the age of 3 years and 4 months. b) Postoperatively: glenohumeral joint with GSA = -6° and PHHA = 40% at the age of 7 years.
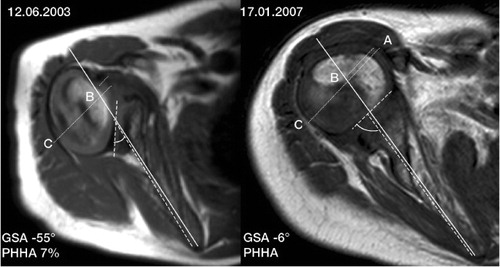
Table 2. Mean Mallet scores pre- and postoperatively
Figure 4. Mean values and standard deviations of summed Mallet scores in different types of operations. Exact p-values are given for statistical comparisons of pre-and postoperative measurements.
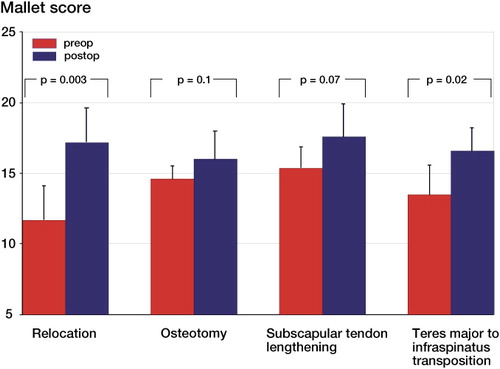
Table 3. All patient-specific Mallet score values pre- and postoperatively