Figures & data
Figure 1. Flow chart of patients.
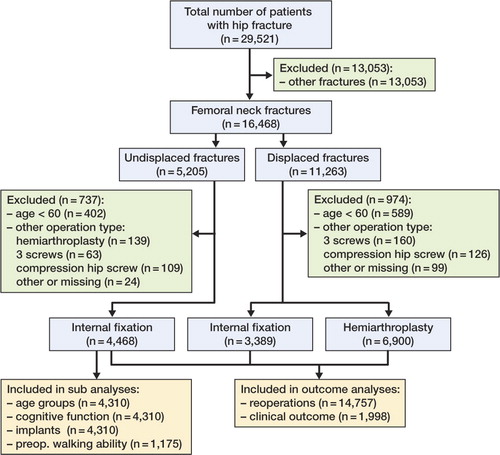
Table 1. Baseline characteristics of patients
Table 3. Type of reoperation
Figure 2. Adjusted survival of implants for the different treatment groups (n = 14,757).
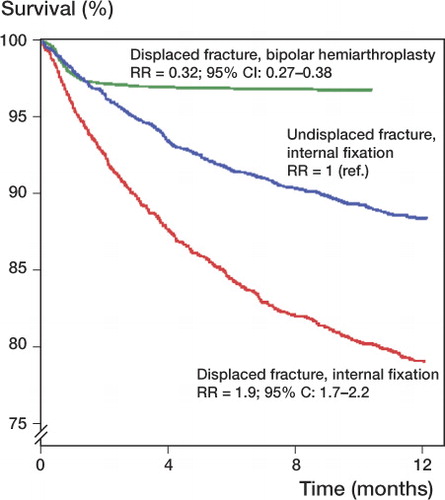
Table 4. Comparison of patient-assessed outcomes in patients according to type of fracture and treatment. Intention-to-treat-analysis. Values are mean (95% CI) [SD]
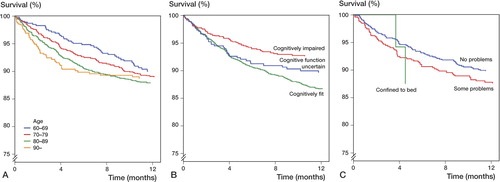
Figure 3. Adjusted survival of implants: A. for undisplaced fracture according to age group (n = 4,310); B. for undisplaced fracture according to cognitive function (n = 4,310); C. for undisplaced fracture according to preoperative walking ability (n = 1,175).
Supplemental material