Figures & data
Figure 1. PRISMA 2009 flow diagram used to identify studies for inclusion in HA tibial analysis.
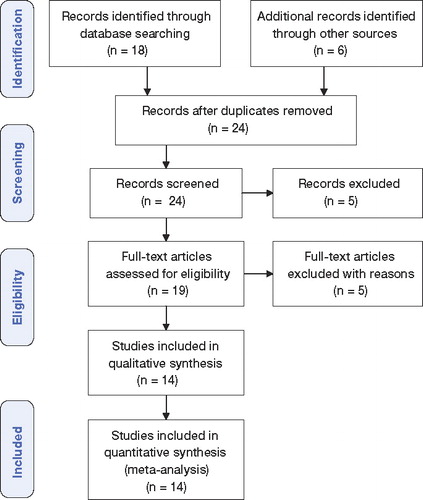
Table 1. The number of evaluable knees used from each trial and included in outcome analysis
Table 2. Durability (pooled data)
Figure 2. RSA analysis year 2; HA-coated vs. other tibial fixation; all implants.
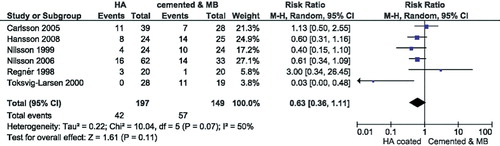
Figure 3. RSA analysis year 2; HA-coated vs. other tibial fixation; all implants except for those with screw fixation of tibial baseplate.
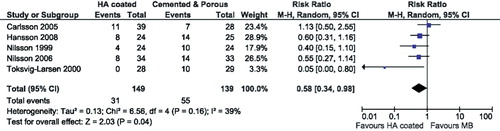
Table 3. Function scores from data at 2 years and 5 years. Statistical method used: Inverse variance, fixed effects analysis model
Figure 4. Adverse events; complications resulting from the surgical procedure and/or subsequent need for surgical intervention or immediate medical attention.
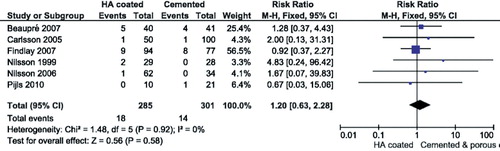
Figure 5. RSA analysis year 2; HA-coated vs. other tibial fixation; all implants except for those with screw fixation of tibial baseplate using an expanded definition of MPTM ≥ 0.2 mm in 2 years.
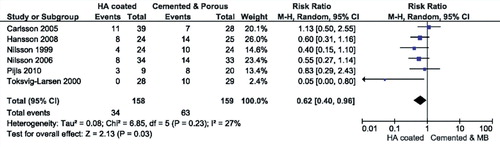
Figure 6. Risk-of-bias graph summary – review of authors' judgments about each risk-of-bias item presented as percentages across all the studies included.
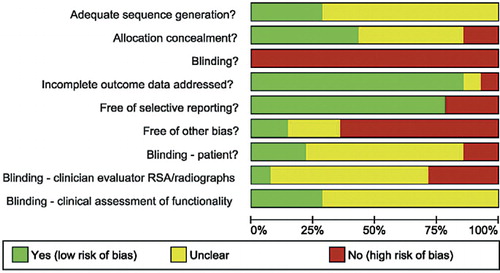
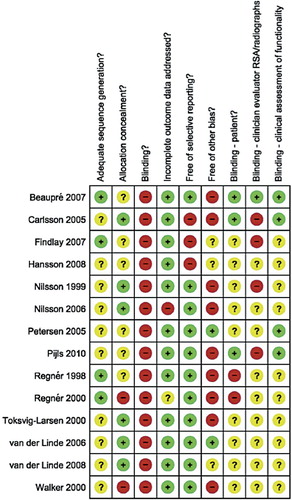
Figure 7. Review of authors' judgments about each risk of bias item for each study included.