Figures & data
Figure 1. Age distribution of patients with distal radius fractures in Reykjavik in 2004.
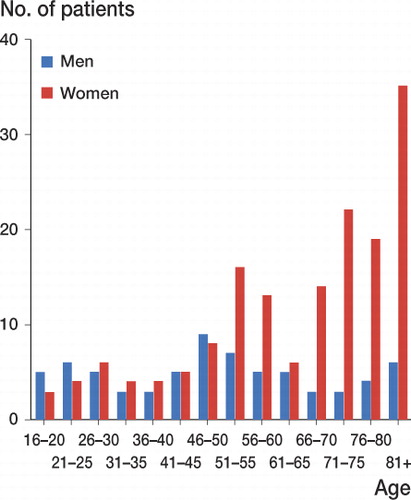
Figure 2. Age-specific incidence of distal radius fractures in women aged over 20 in 2004 (with 95% confidence intervals) compared with the 1985 study (Robertsson et al. Citation1990). (Here, age over 20 is used for comparison with the figure of Robertsson et al.). a (See )
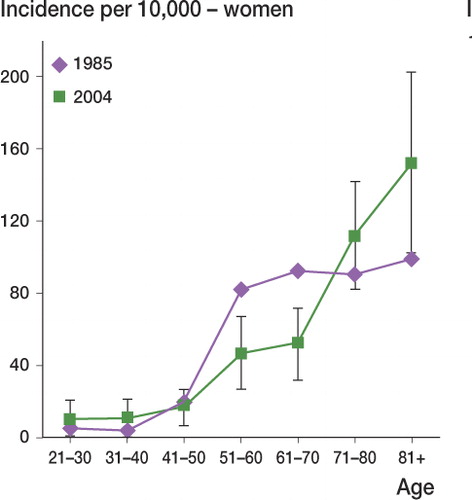
Figure 3. Age-specific incidence of distal radius fractures in men over 20 in 2004 (with 95% confidence intervals) compared with the 1985 study (Robertsson et al. Citation1990). (Here, age over 20 is used for comparison with the figure of Robertsson et al.). a (See )
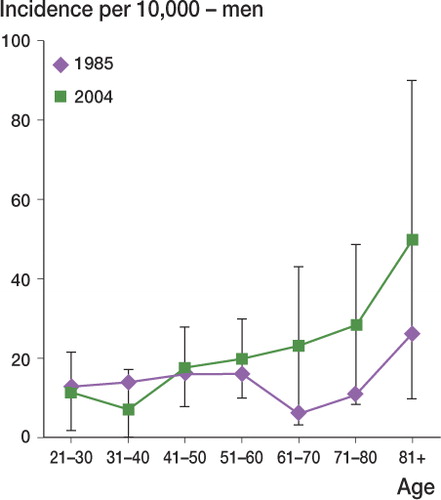
Figure 4. Seasonal variation of distal radius fractures in Reykjavik in 1985 and 2004. The figures from 1985 are not exact but approximated from figures from the original article (Robertsson et al. Citation1990).
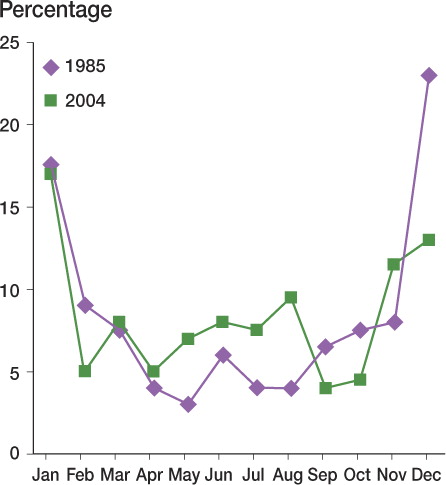
Table Number of distal radius fractures and incidence per 104 individuals for each age group, in Reykjavik in 2004, according to the modified AO classification. (Here, age over 18 is used for comparison with the table from Brogren et al. (Citation2007))