Figures & data
Figure 1. Study instrumentation. This schematic diagram shows the proximally directed 22-gauge spinal needle placed through the medial cortex of the tibia, connected via a 3-way tap to a saline-filled syringe for flushing and a pressure transducer. The pressure transducer, line, and needle were subject to a constant low rate (3 mL/h) flushing with saline to ensure patency.
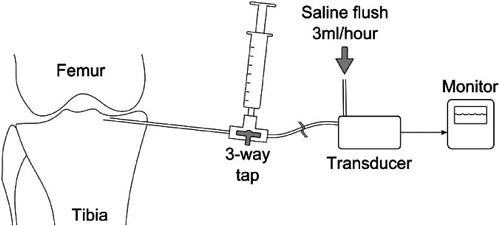
Figure 2. Mean-normalized pressure following saline injection for operated and intact limbs in the treatment and placebo groups at the four measurement stages: at induction of arthritis (A), prior to treatment/placebo (B), following treatment/placebo (C), and after washout period (D). Pressure values were individually normalized to the mean value for the time period 180–600 s to simplify comparisons of pressure changes between groups. Although mean pressures for all limbs are initially similar, the operated and intact limbs diverge with the development of arthritis. This divergence diminishes markedly following treatment with dobesilate, but barely changes in the placebo group. Error bars represent 1 SD.
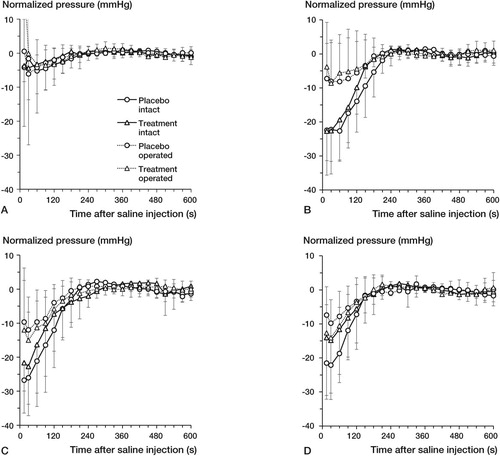
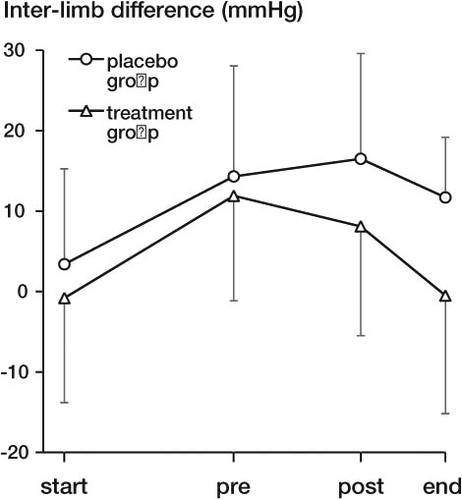
Figure 3. Pressure range differences between intact and operated limbs for the treatment and placebo groups throughout the study period (start: start of study; pre: pre-treatment; post: post-treatment; end: end of study). The pressure range was defined as the difference in measured pressure between the minimum over 15–150 s post-injection and the mean over 180–600 s post-injection. Differences were calculated as intact range minus operated range and displayed as mean values. Error bars represent 1 SD and are shown on one side only for clarity.