Figures & data
Table 1. Distribution of children in relation to CP subtypes based on the Surveillance of Cerebral Palsy in Europe (SCPE) and GMFCS level
Table 2. Distribution of measurements in relation to CP subtypes based on the Surveillance of Cerebral Palsy in Europe (SCPE) and GMFCS level
Table 3. The original Ashworth scale and the number of examinations at each level in the present study
Figure 1. Development of dorsiflexion of the ankle joint (mean, 95% CI) up to 18 years of age in the total sample of 355 children with CP. The analysis is based on 2,796 examinations of both legs in all 355 children.
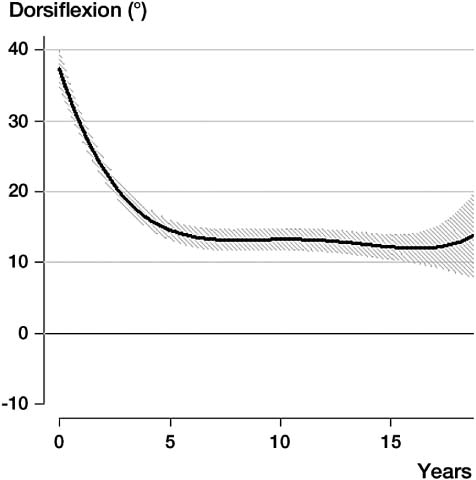
Figure 2. Development of dorsiflexion of the ankle joint (mean, 95% CI) related to level of spasticity according to the Ashworth scale.
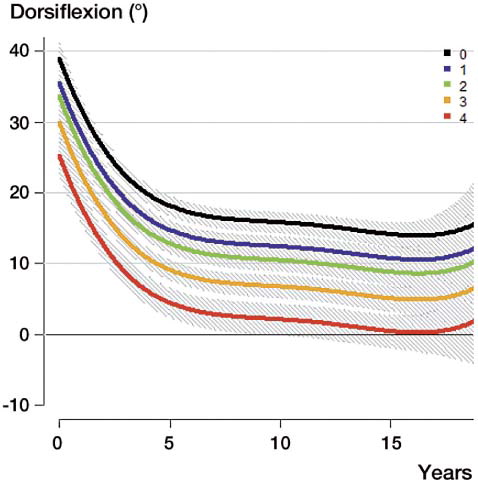
Table 4. The predicted mean difference in ROM, between children with normal muscle tone and children with different levels of increased muscle tone, over the entire follow-up interval from 0 to 18 years, related to CP subtype and GMFCS level