Figures & data
Figure 1. Flowchart of the study.
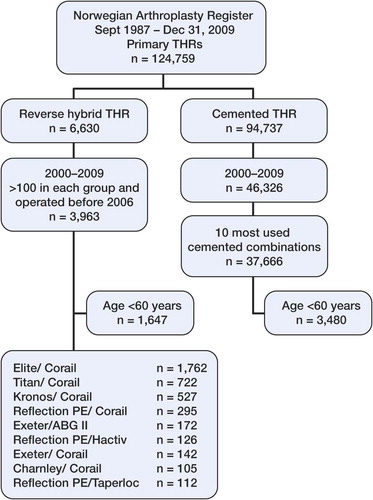
Table 1. Breakdown of numbers of different combinations of prosthesis components in the reverse hybrid group during the study period
Table 2. Comparison of different combinations of prosthesis components in the reverse hybrid group
Table 3. Cup/stem combinations in the cemented group. These have been thoroughly described by Espehaug et al. (Citation2009)
Table 4. Details of the characteristics of the uncemented femoral stems used in the reverse hybrid group. 97% had HA coating
Table 5. Comparison of demographic data for cemented and reverse hybrid THRs, both for total material and for patients aged < 60 years. Comparison of survival (in %) and relative risk (RR) of revision for cemented and reverse hybrid THRs, with all revisions as endpoint, for total material and for patients aged < 60 years
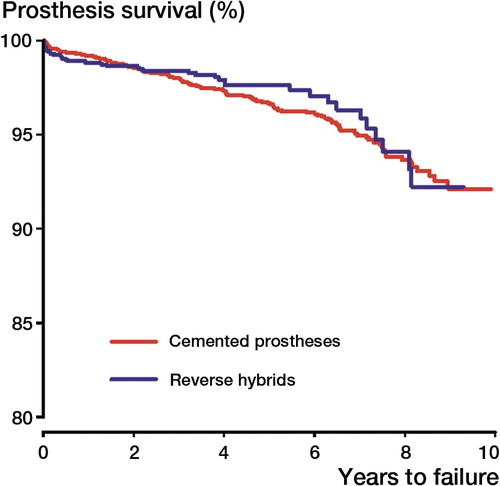
Figure 2. Cox survival curves. Endpoint was any revision of the implant for the total material. Adjusted for age, sex, and diagnosis. Age: < 50, 50–59, 60–69, 70–79 and > 80. Diagnosis: OA, RA/inflammatory, or other.
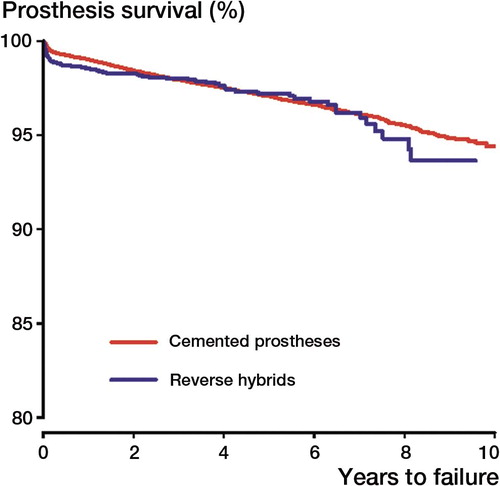
Figure 3. Cox survival curves. Endpoint was any revision of the implant. Age < 60 years. Adjustment for age, sex, and diagnosis. Age: <50, 50–60. Diagnosis: OA, RA/inflammatory, or other.