Figures & data
Figure 1. A. Sagittal view of the PFC design (left) and the CKS design (right). B. Anterior view of a computer model of the femoral components. Notice the lateral orientation of the trochlea in PFC (left) and neutral orientation in the CKS component (right). C. Posterior view of the tibial and PE insert components. The central posterior edge of the CKS insert (right) is relatively sharp compared to the PFC insert (left).
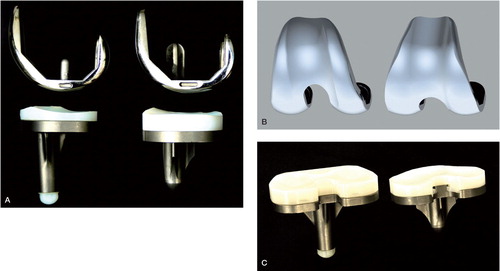
Table 1. Patient demographics and baseline clinical status
Figure 2. Flow diagram according to the CONSORT guidelines.
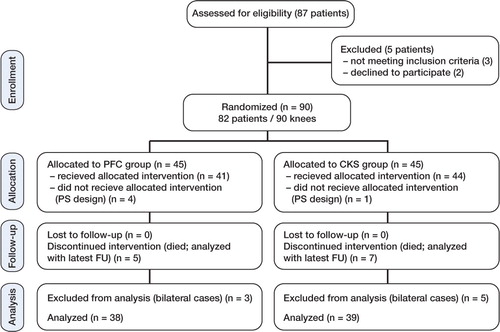
Table 2. Clinical results
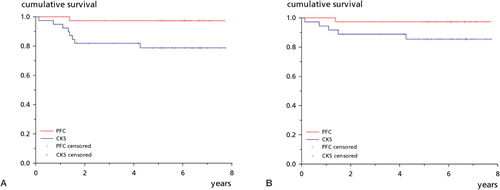
Figure 3. Kaplan-Meier survival plots. A. With revision for any reason as endpoint, the PFC group had a survival of 97% (95% CI: 92–100) after 8 years and the CKS group had a survival of 84% (72–96) (p = 0.05). B. With aseptic revision as endpoint, the PFC group had a survival of 97% (92–100) after 8 years and the CKS group had a survival of 89% (78–99) (p = 0.2).
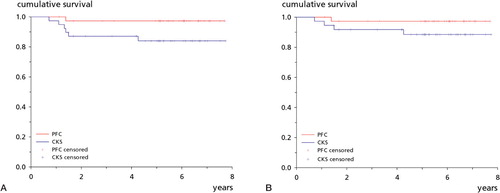
Figure 4. Kaplan-Meier survival plots. A. With any reoperation as endpoint, the PFC group had a survival of 97% (95% CI: 92–100) after 8 years and the CKS group had a survival of 79% (66–92) (p = 0.02). B. With aseptic reoperation as endpoint, the PFC group had a survival of 97% (92–100) after 8 years and the CKS group had a survival of 85% (73–97) (p = 0.08).