Figures & data
Table 1. Numbers of ankle prostheses implanted in Sweden annually
Table 2. Demographic data
Table 3. Reasons for revision
Figure 1. Estimated cumulative survival and 95% CI for all 780 arthroplasties.
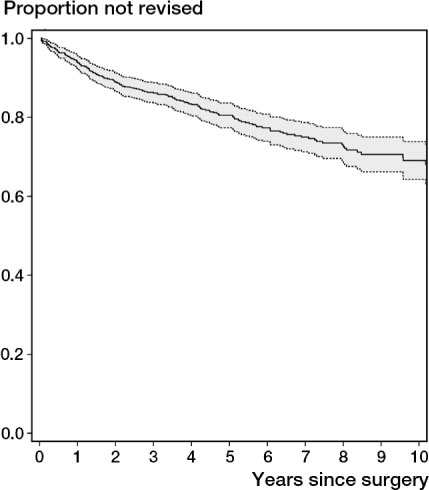
Table 4. Life table
Figure 2. Estimated cumulative survival for ankles replaced due to rheumatoid arthritis (purple), osteoarthritis (red), and posttraumatic osteoarthritis (green).
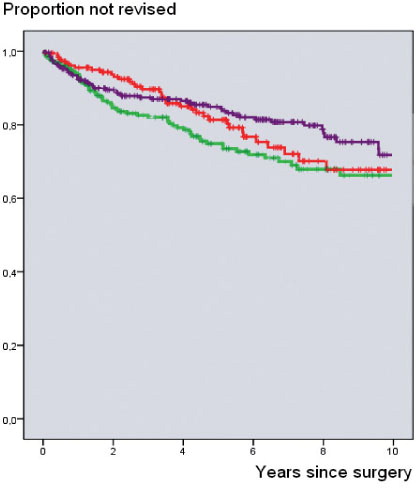
Figure 3. Estimated survival for the different designs implanted. The blue curve represents the BP-type designs, the green curve the Hintegra, the purple curve the double-coated STAR, and the red curve the single-coated STAR prostheses.
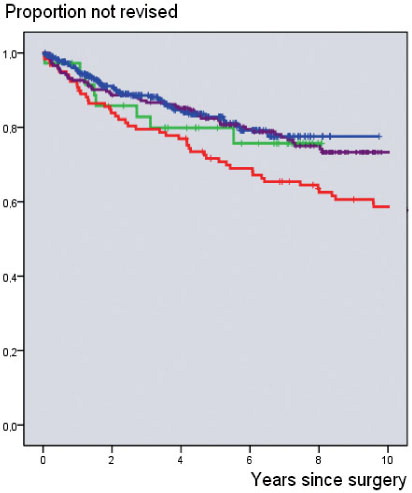
Table 5. Hazard ratio (HR) of survival rates for different prostheses
Table 6. Time (years) and 95% CI from index surgery to revision