Figures & data
Table 1. Number of femur and tibia SIGN nail operations, follow–up, and infection rates by country in the SOSD in October 2010
Table 2. Total number of SIGN nails and follow-up according to sex, geographic region, and income level of country
Table 3. Follow-up for each age group compared to the < 20-year age group
Figure 1. Poisson regression analysis. Pattern of follow-up rate over time for femur and tibia fractures in the SOSD. The color band signifies the 80% range of values between countries.
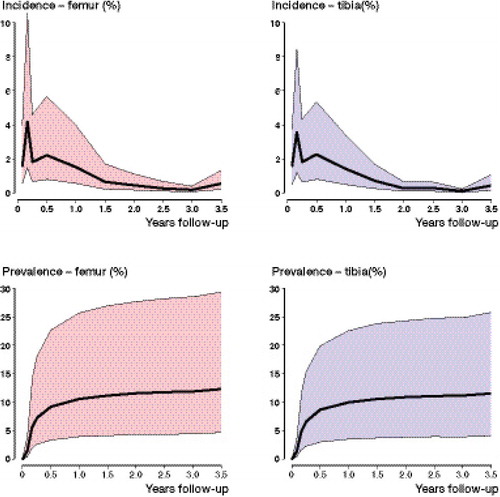
Figure 2. Poisson regression analysis. Pattern of infection rate for femur and tibia fractures over time in the SOSD. The color band signifies the 80% range of values between countries.
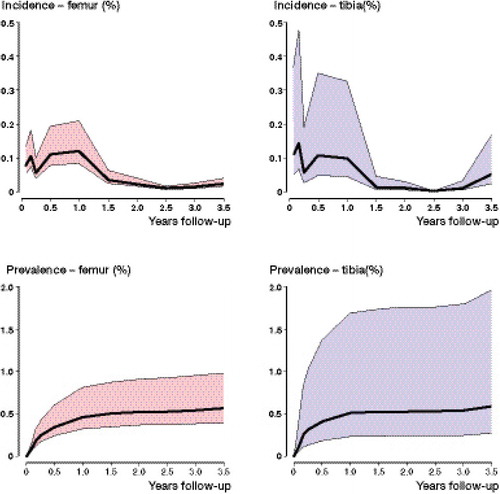
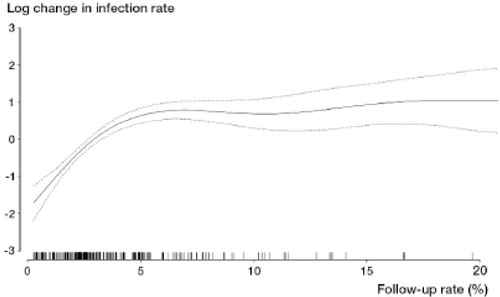
Figure 3. Follow-up rate plotted against log change in the infection rate. The curve is based on a generalized additive regression model (gam). Dotted lines represent 95% CI. With follow-up over 5%, there is very little increase in infection rate and the curve is consequently nearly horizontal. Short vertical lines on x-axis represent observations in different countries.