Figures & data
Figure 1. Coronal alignment error calculated trigonometrically.
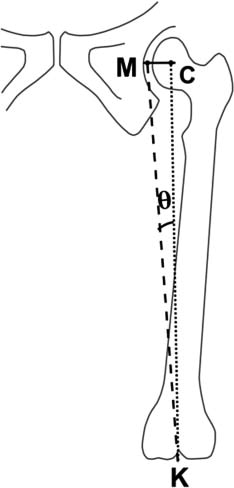
Figure 2. Illustration of 3 landmarks for determination of the center of the femoral head: A (left panel); I (center panel); F (right panel). ASIS: anterosuperior iliac spine; FA: femoral artery; PT: pubic tubercle; SP: symphysis pubis.
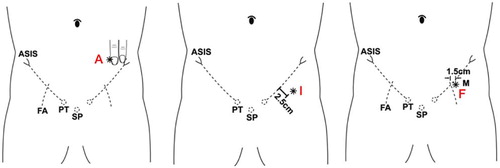
Figure 3. A. The distance between femoral head centers on both sides was measured on a radiograph of the pelvis. B. A customized metal ruler with two mobile pegs was developed to replicate the inter-femoral head distance. Dotted line: pelvic midline; empty arrow: center rod; solid arrow: mobile peg (landmark X).
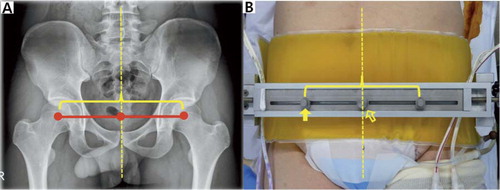
Table 1. Distances (mm) between the estimated and real femoral head centers
Table 2. Location of each landmark of the 4 methods
Figure 4. Overall distribution for each method, indicating the number of cases at intervals of 4 mm.
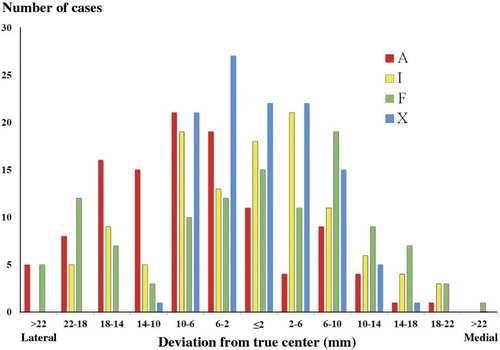
Table 3. Amount of errors in the estimation of the real femoral head center. Values are number of cases (percentage) within limit.
Table 4. Factors affecting results of the four methods. Values are median distance (mm) and (Q1, Q3)