Figures & data
Table 1. Descriptive data on 91,410 ankle fractures in Sweden during the period 1987–2004
Figure 1. Incidence rates (per 105 person-years with 95% CI) of ankle fractures in Sweden during the period 1987–2004, stratified by sex and year.
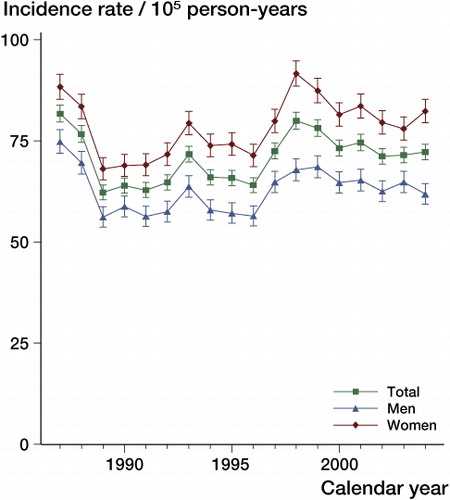
Figure 2. Incidence rates (per 105 person-years with 95% CI) of ankle fractures in Sweden during the period 1987–2004, stratified by age and sex.
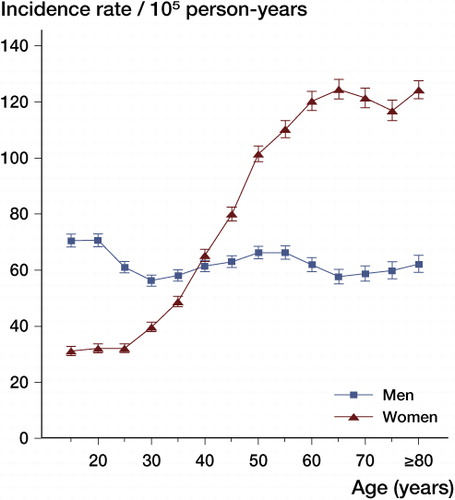
Figure 3. Incidence rates (per 105 person-years) of ankle fractures in Sweden during the period 1987–2004, stratified by age, sex, and type of fracture. Note the different scale for open fractures.
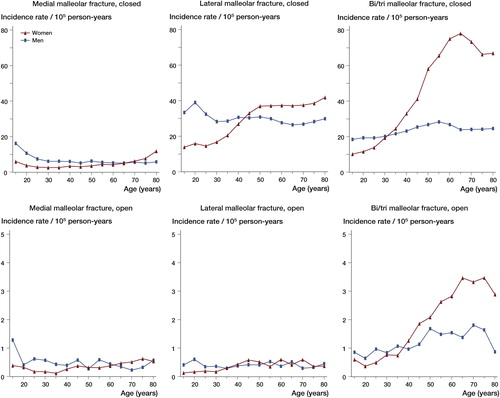
Table 2. Mechanisms of injury
Table 3. Surgical procedures (within 30 days of first admission)