Figures & data
Table 1. Registration rate for primary and revision anterior cruciate ligament surgery in the NCLR for all public hospitals, based on operation counts for 2008 and 2009 in the Norwegian Patient Register (NPR) and the Norwegian Cruciate Ligament Register (NCLR)
Table 2. Registration rate for primary and revision anterior cruciate ligament surgery in the NCLR, comparing the 2 subgroups of small and large public hospitals (< 30 and ≥ 30 annual operations) in 2008 and 2009, based on operation counts in the NPR and the NCLR
Figure 1. The spread in registration rate for small and large public hospitals that performed primary or revision anterior cruciate ligament surgery in 2008 and 2009. The graph contains 3 dimensions of information. The registration rate percent for each hospital unit is arranged in ascending order at the x-axis to illustrate differences between the hospital groups (dimension 1). Each point represents one hospital, and the size of each point is relative to operation volume—showing the contribution of one single hospital unit to the average registration rate. The point sizes range from 2 to 24; e.g. 0–20 operations received point size 2, 30 operations received point size 3, and 240 operations received point size 24 (dimension 2). The reporting rate percent for each hospital unit is plotted on the y-axis (dimension 3).
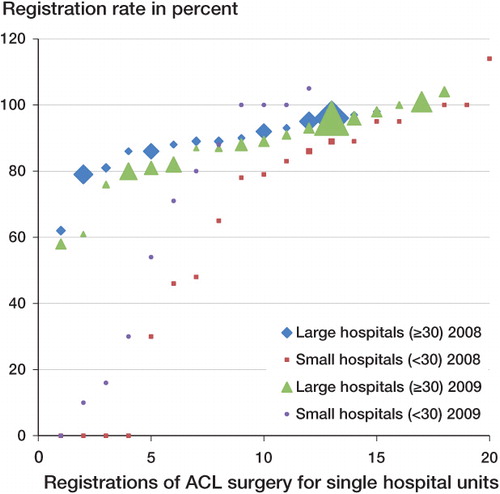
Figure 2. The spread in registration rate of all 44 public and private hospitals that performed cruciate ligament surgery in 2008. The graph contains 3 dimensions of information. The registration rate percent for each hospital unit is arranged in ascending order at the x-axis to represent differences between the hospital groups (dimension 1). Each point represents one hospital, and the size of each point is relative to operation volume—showing the contribution of one single hospital unit to the average registration rate. The point sizes range from 2 to 24; e.g. 0–20 operations received point size 2, 30 operations received point size 3, and 240 operations received point size 24 (dimension 2). The reporting rate percent for each hospital unit is plotted on the y-axis (dimension 3).
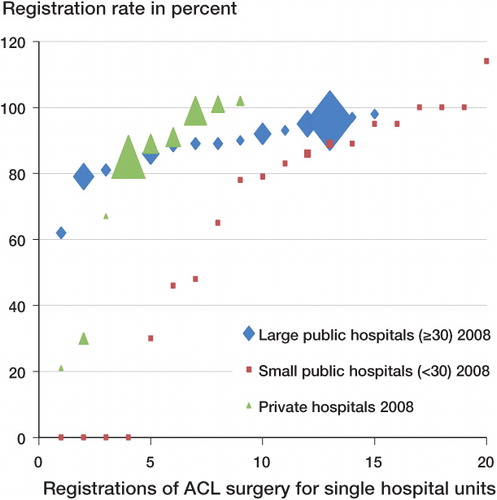
Table 3. Registration rate for primary and revision anterior cruciate ligament surgery for all 35 public and 9 private hospitals in 2008, based on operation counts in the Norwegian Cruciate Ligament Register (NCLR), the Norwegian Patient Register (NPR) and the electronic patient charts (EPCs)
Table 4. A comparison of registration rate and operation counts for primary and revision anterior cruciate ligament surgery in 7 public hospitals in 2006, 2008, and 2009, based on the Norwegian Cruciate Ligament Register (NCLR) and the Norwegian Patient Register (NPR)