Figures & data
Table 1. Type of diagnosis at primary THA within the 2 groups of patients with HA-coated and uncoated revision cups
Table 2. Characteristics of the study population
Table 3. Use of bone graft at index cup revision within the 2 groups (HA-coated and uncoated revision cups)
Table 4. Relative risk (RR) for cup re-revision for any reason
Figure 1. Unadjusted Kaplan-Meier survival with hydroxyapatite (HA) coating as the independent factor and cup re-revision due to any reason as the endpoint. 10-year survival was 88.7% (CI: 85.5–92.0) for the HA-coated cups (red) and 87.2% (CI: 83.8–90.7) for the uncoated cups (blue). The dashed lines represent 95% confidence intervals for the 2 groups of cups.
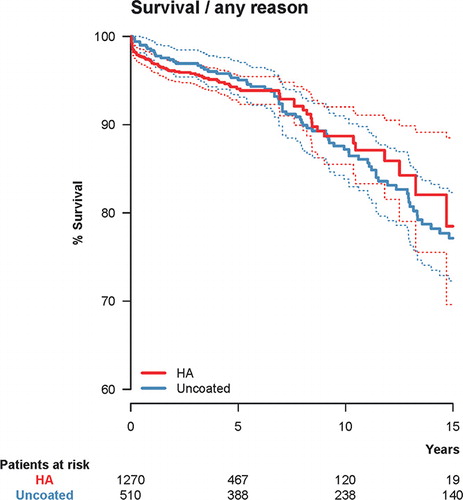
Table 5. Relative risk (RR) for cup re-revision due to aseptic loosening
Figure 2. Unadjusted Kaplan-Meier survival with hydroxyapatite (HA) coating as the independent factor and cup re-revision due to aseptic loosening as the endpoint. 10-year survival was 94.7% (CI: 91.9–97.5) for the HA-coated cups (red) and 91.9% (CI: 89.1–94.8) for the uncoated cups (blue). The dashed lines represent 95% confidence intervals for the 2 groups of cups.
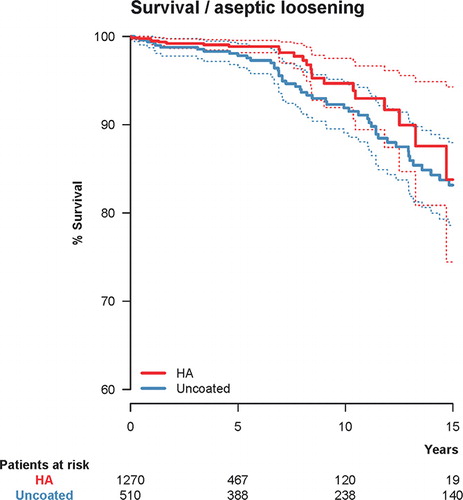
Table 6. Exploratory analyses using putatively relevant covariates. Adjusted relative risk (RR) for cup re-revision for any reason
Table 7. Distribution of the 3 most commonly used stems combined with the cup types Trilogy (A) and Harris-Galante (B)